
Statistics Teacher/STatistics Education Web: Online Journal of K-12 Statistics Lesson Plans 1
https://www.statisticsteacher.org/ or http://www.amstat.org/education/stew/
Contact Author for permission to use materials from this lesson in a publication
How long are the words in the Gettysburg Address?
Gary Kader (Appalachan State University), Christine Franklin (ASA, University of Georgia),
Tim Jacobbe (Southern Methodist University), and Kaycie Maddox (Northeast Georgia RESA)
Published: November 2020
Overview of Lesson
In this lesson, each student tries two methods for selecting a sample from the population of
words in the Gettysburg Address: self-selection and simple random sampling. Then, as a class,
students construct dotplots and calculate numerical summaries to show how sample means vary
from sample to sample. Using these plots and numerical summaries, students see that self-
selected samples tend to over-represent the longer words in the Gettysburg Address and produce
sample means that are larger than the actual population mean (biased sampling method). On the
other hand, simple random samples tend to be representative of the population and produce
sample means balanced on both sides of the population mean (unbiased sampling method).
Finally, students explore the relationship between sample size and sample-to-sample variability.
Students discover that larger random samples produce sample means with less variability.
Type of Data
• Choose one: One quantitative variable
• Choose one: Static dataset provided by lesson plan authors
Learning Objectives
• CCSSM.7.SP.A.1: Understand that statistics can be used to gain information about a
population by examining a sample of the population; generalizations about a population
from a sample are valid only if the sample is representative of that population.
Understand that random sampling tends to produce representative samples and support
valid inferences.
• CCSSM.7.SP.A.2: Use data from a random sample to draw inferences about a population
with an unknown characteristic of interest. Generate multiple samples (or simulated
samples) of the same size to gauge the variation in estimates or predictions.
Audience
• The authors have tested this lesson with middle and high school students, pre-service and
in-service teachers, and mathematics teacher educators.
• This lesson is also appropriate for post-secondary students.
• Prerequisites: Displaying numerical data in plots on a number line (e.g., dotplots),
calculating quantitative measures of center and spread (e.g., mean and range), and some
experience with data collection.
Time Required
• Two 50-75 minute periods

Statistics Teacher/STatistics Education Web: Online Journal of K-12 Statistics Lesson Plans 2
https://www.statisticsteacher.org/ or http://www.amstat.org/education/stew/
Contact Author for permission to use materials from this lesson in a publication
Technology and Other Materials
• Technology: Random digits generator (random.org, calculator, or spreadsheet)
• Student handout (includes sequentially numbered list of words in the Gettysburg
Address)
• Three Sheets from a Large Gridded Pad scaled from 1 to 11 (provide 5 spaces between
each tick). Label these as Dotplots 1.2, 2.2, and 3.1
Lesson Plan
The following investigation is adapted from NCTM’s Developing Understanding of Statistics for
Teaching Mathematics in Grades 6-8 (2013).
Authorship of literary works is often a topic for debate. One method researchers use to decide
who was the author is to look at word patterns from known writing of the author and compare
these findings to an unknown work. To help us understand this process we will analyze the
length of the words in the Gettysburg Address, authored by Abraham Lincoln.
The Gettysburg Address shown below was delivered by Abraham Lincoln on November 19,
1863 on the battlefield near Gettysburg, Pennsylvania. It is one of the most famous speeches
ever given by an American President.
Four score and seven years ago our fathers brought forth on this continent, a new nation,
conceived in Liberty, and dedicated to the proposition that all men are created equal.
Now we are engaged in a great civil war, testing whether that nation, or any nation so
conceived and so dedicated, can long endure. We are met on a great battlefield of that
war. We have come to dedicate a portion of that field, as a final resting place for those
who here gave their lives that that nation might live. It is altogether fitting and proper that
we should do this.
But, in a larger sense, we cannot dedicate -- we cannot consecrate -- we cannot hallow --
this ground. The brave men, living and dead, who struggled here, have consecrated it, far
above our poor power to add or detract. The world will little note, nor long remember
what we say here, but it can never forget what they did here. It is for us the living, rather,
to be dedicated here to the unfinished work which they who fought here have thus far so
nobly advanced. It is rather for us to be here dedicated to the great task remaining before
us -- that from these honored dead we take increased devotion to that cause for which
they gave the last full measure of devotion -- that we here highly resolve that these dead
shall not have died in vain -- that this nation, under God, shall have a new birth of
freedom -- and that government of the people, by the people, for the people, shall not
perish from the earth.
In this lesson, students collect their own samples from the Gettysburg address. Using the mean
word length from those samples, students estimate the population mean word length.

Statistics Teacher/STatistics Education Web: Online Journal of K-12 Statistics Lesson Plans 3
https://www.statisticsteacher.org/ or http://www.amstat.org/education/stew/
Contact Author for permission to use materials from this lesson in a publication
The lesson plan consists of three parts. In each part, students collect their own samples of words
then work together as a class to describe sample-to-sample variability. In Part I, each student
uses non-random sampling method (self-selection) to choose ten words from the Gettysburg
Address. In Part II, each student uses a random number generator to select a simple random
sample of size ten. In Part III, each student selects another simple random sample, this time of
size five.
Part I – Self-Selected Sampling
Formulate a Statistical Question
Begin by pointing out to students that the length of a word (number of characters) in the
Gettysburg Address varies from word to word. For example, the first word “Four” is of length 4
(4 characters), while the second word, “score”, has 5 characters, so the length is 5. Note that
length of a word is a discrete quantitative variable. A statistical question we might ask is:
How do the lengths of words in the Gettysburg Address vary?
1. a. Have students identify the population of interest (all words of the Gettysburg Address)
and the variable of interest (length of a word).
1. b. Describe how would you select a sample of words to produce a sample that is similar to
(representative of) the population?
Note: The numbering system in this lesson plan corresponds to the numbered questions on the
attached student handouts.
Point out that the word lengths vary and that the population of all word lengths has a distribution,
which can be summarized by describing its shape, center, and the variability. To address the
question, “How do the lengths of words in the Gettysburg Address vary?”, we could examine the
distribution of word length for all words in the Gettysburg Address. Instead, we will select a
subset (sample) of words with the goal of producing a sample of words that has a distribution
that is similar to the population distribution of word length. That is, the shape, center and
variability of the sample data distribution are similar to that of the population distribution. In this
investigation, we will explore two methods for selecting a sample of words.
Collect Appropriate Data
Have each student circle 10 words they think are “representative” of the varying word lengths in
the Gettysburg Address. The resulting 10 words constitute a self-selected sample from the
population of 268 words in the entire Gettysburg Address. Have students record their words and
word lengths in Table 1.1 (provided in student materials), as illustrated below.

Statistics Teacher/STatistics Education Web: Online Journal of K-12 Statistics Lesson Plans 4
https://www.statisticsteacher.org/ or http://www.amstat.org/education/stew/
Contact Author for permission to use materials from this lesson in a publication
Table 1.1. – Sample of 10 Words/Sample 1
Word Number Selected Word Length of Word
1 created 7
2 testing 7
3 battlefield 11
4 larger 6
5 consecrate 10
6 remember 8
7 advanced 7
8 rather 6
9 unfinished 10
10 here
4
Total 76
Analyze Data and Interpret Results
2. Using the plot provided in the student materials (Dotplot 1.1), have each student create a
dotplot for their word-length data. The dotplot for the data displayed in Table 1.1 is
shown below. Have students compare their distribution with other students. Are they the
same or different? Results will vary from student to student.
Based on their dotplot, have each student summarize the data in their sample. For
example, based on the above plot, the 10 words have lengths between 4 and 11
characters, and the center appears to be between around 7 characters. The range is 7
characters. The shape is not very clear, which may be the result of the small sample size.
3. Ask for volunteers to share their dotplot and to describe their strategy (if any) for the
sample they selected. Answers will vary.
4. What is a typical length for the words in the Gettysburg Address? One quantity that is
used to measure “typical” is the mean. Have each student compute the mean for their
sample. (The mean for the data in Table 1.1 is 76/10 = 7.6 characters). Ask the class “Do
all the samples produce the same mean?” Have some students report their mean and point
out that the sample means vary from one sample to another.
5. Using a sheet from a Large Gridded Pad have each student place a “sticky dot”
on the plot as close as possible over their sample mean to create a dotplot displaying the
Statistics Teacher/STatistics Education Web: Online Journal of K-12 Statistics Lesson Plans 5
https://www.statisticsteacher.org/ or http://www.amstat.org/education/stew/
Contact Author for permission to use materials from this lesson in a publication
sample means for the entire class. Students whose data have the same mean should stack
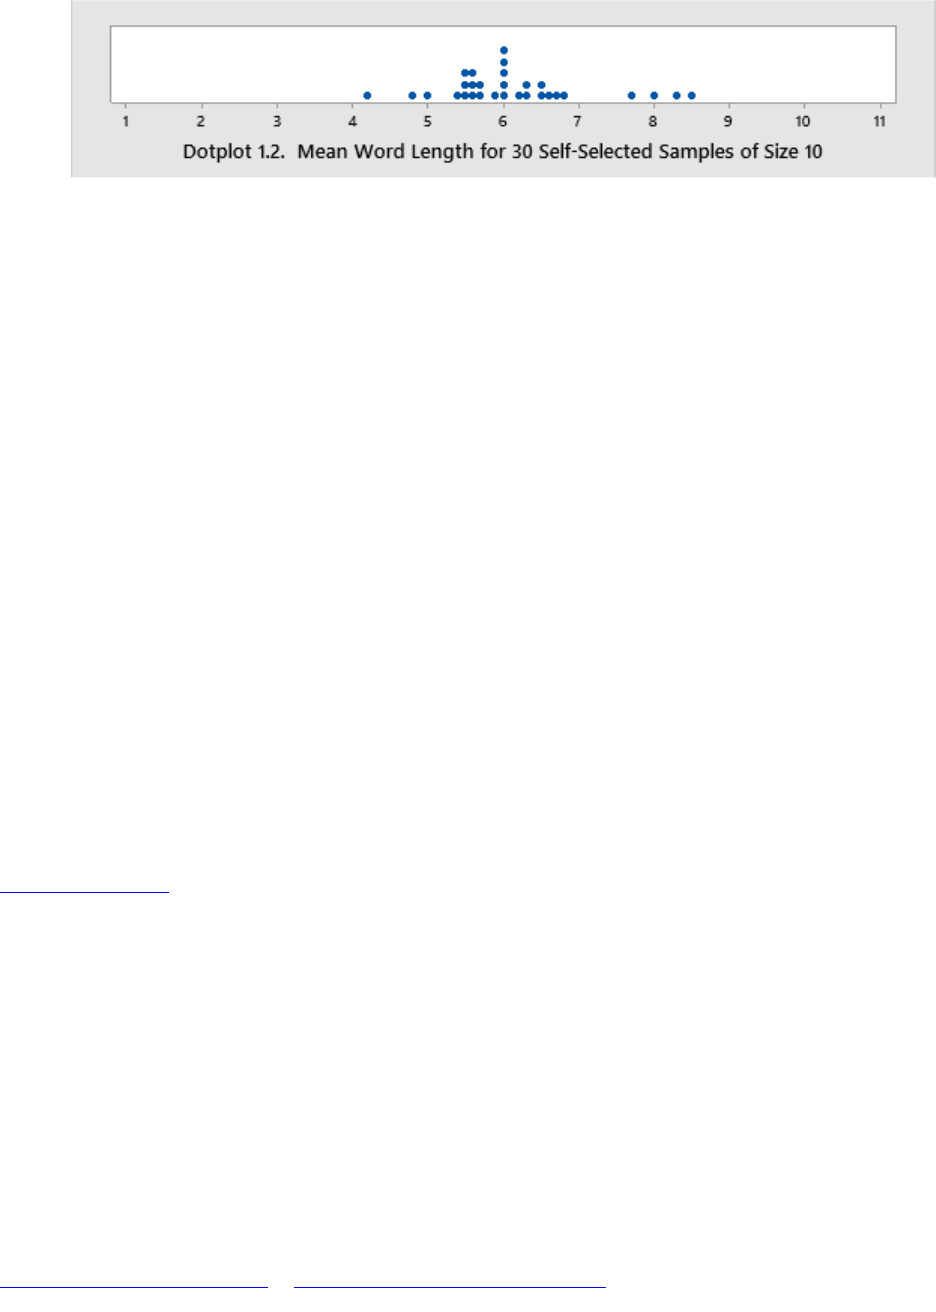
one dot above another. Results will vary from class to class. A hypothetical dotplot for a
class of 30 students is shown below:
Remind students that this plot is displaying sample means and illustrates the sample-to-
sample variability in these 30 means.
Based on Dotplot 1.2 for their class, have students summarize the results of their means.
For example, based on the above plot, the means have between 4.2 and 8.7 characters,
and the center is around 6 characters. The range is 4.5 characters, and the display is
skewed right. If we consider the two values above 8 as unusually large, a range of typical
values for a sample mean using self-selected sampling might be from 4.2 to 8.0
characters.
Part II – Simple Random Sampling
Collect Appropriate Data
Another way to select a sample from a population is to use simple random sampling. How do we
select a simple random sample of 10 words from the Gettysburg Address?
On the last pages of the attached student handout file are copies of a list of the words in the
Gettysburg Address. Note that there are 268 words, and each word is assigned a number from 1
(001) to 268. To randomly select 10 words from the Gettysburg Address we will generate 10
distinct random integers between 1 and 268 and select the corresponding word from the
Gettysburg Address. Many calculators or computer apps are useful for generating random
integers. One such computer application can be found and used free of charge at
www.random.org
At this web-site, have each student select “Numbers” and “Integer Set Generator.” Complete
Step 1 as indicated below and click on “Get Sets” in Step 3. Sample output from this app are
shown below.

Statistics Teacher/STatistics Education Web: Online Journal of K-12 Statistics Lesson Plans 6
https://www.statisticsteacher.org/ or http://www.amstat.org/education/stew/
Contact Author for permission to use materials from this lesson in a publication
Have students enter their 10 random integers in Table 2.1. Next, provide them with a copy of the
list of the words so they can identify the corresponding words from the Gettysburg Address and
the length of each word as illustrated below:

Statistics Teacher/STatistics Education Web: Online Journal of K-12 Statistics Lesson Plans 7
https://www.statisticsteacher.org/ or http://www.amstat.org/education/stew/
Contact Author for permission to use materials from this lesson in a publication
Table 2.1. Random Sample of 10 Words/Sample 2
Random Integer
Selected Word
Length of Word
5
y
ears
5
48
c
onceived
9
75
a
s
2
158
t
hey
4
171
h
ere
4
188
is
2
190
f
or
3
258
t
he
3
259
p
eople
6
264 not
3
Total
41
Analyze Data and Interpret Results
6. Using the plot provided in the student materials (Dotplot 2.1), have each student create a
dotplot for their word-length data. Results will vary from student to student. The dotplot
for the data displayed in Table 2.1 is shown below:
Based on their dotplot, have students summarize the data in their random sample. For
example, based on the above plot, the 10 words have lengths between 2 and 9 characters,
the center appears to be between 3 and 4 characters. The range is 7 characters, and the
shape is skewed right.
7. Have each student compute the mean for their random sample. (The mean for the data in
Table 2.1 is 41/10 = 4.1 characters.) Do all samples produce the same mean? Ask some
students to report their mean and point out that the sample means vary from one sample
to another.
8. Using a sheet from a Large Gridded Pad, have each student place a “sticky dot”
on the plot as close as possible over their sample mean to create a dotplot displaying the
sample means for the entire class. Students having the same mean should stack one dot
above another. Results will vary from class to class. A hypothetical dotplot for a class of
30 students is shown below:

Statistics Teacher/STatistics Education Web: Online Journal of K-12 Statistics Lesson Plans 8
https://www.statisticsteacher.org/ or http://www.amstat.org/education/stew/
Contact Author for permission to use materials from this lesson in a publication
Remind students that this plot is displaying sample means and illustrates the sample-to-
sample variability in these 30 means.
Based on Dotplot 2.2 for the class data, have students summarize their results. For
example, based on the above plot, the means have between 2.9 and 5.6 characters, and the
center is around 4.4 characters. The range is 2.7 characters, and the display is reasonably
symmetric. A range of typical values for a sample mean using simple random sampling
might be from 2.9 to 5.6 characters.
9. Have students compare Dotplots 1.2 (30 Means from Self-Selected Samples) and Dotplot
2.2 (30 Means from Simple Random Samples). Specifically, have them compare their
centers and variability.
Note that the center for the means of simple random samples (Sample 2) is around 4.4
versus around 6 for self-selected sample (Sample 1). Also, there appears to be less
variability in the means for simple random samples. (Range for Simple Random is 2.7
versus 4.5 for Self-Selected). The range of typical values for Simple Random Sampling is
2.9 to 5.6, much narrower than a range of 4.2 to 8.0 for Self-Selected Sampling. Results
will vary from class to class.
10. Ask students to think about which sampling method they think is more likely to produce
a representative sample. Follow up with a class discussion.
11. Next, have students examine the histogram of word lengths for the entire population of
all 268 words in the Gettysburg Address (provided in the student handout) and shown
below.

Statistics Teacher/STatistics Education Web: Online Journal of K-12 Statistics Lesson Plans 9
https://www.statisticsteacher.org/ or http://www.amstat.org/education/stew/
Contact Author for permission to use materials from this lesson in a publication
Ask students to comment on the population distribution. Specifically, the word lengths
are between 1 and 11 characters, the center is around 4 characters, and the range is 10
characters. Also, point out that most words in the Gettysburg Address are fairly short (2,
3, or 4 characters), and only a few words are long (8 or more characters).
12. Inform students that the mean of the population of 268 words is approximately 4.3
characters. Have students draw a vertical line at 4.3 in Dotplot 2.3 as shown below:
Have students compare the sample means from the two sampling methods with the actual
population mean of 4.3.
For example, using the hypothetical results for 30 self-selected samples (Sample 1), only
one sample mean is below the population mean of 4.3, none is equal to 4.3 and twenty-
nine (29) are greater than 4.3. Thus, the samples resulting from self-selection tend to
produce samples with means that are larger than the population mean. With self-selection
longer words tend to be over-represented in a sample. This over-representation of the
longer words is called sampling bias.
On the other hand, of the 30 means from simple random sampling (Sample 2) 12 are
below 4.3, two are equal to 4.3 and 16 are above 4.3. Thus, simple random sampling
tends to produce sample means on both sides of the population mean. When selecting
samples of words from the Gettysburg Address simple random sampling tends to produce
samples that are representative of the population.
Part III – Simple Random Sampling and Sample Size
Parts I and II of this investigation are designed to illustrate that simple random sampling is an
unbiased sampling method. In Part III, students explore the relationship between sample size
and how close a sample mean from a simple random sample is to the actual population mean.
Collect Appropriate Data
Begin by having students use a random number generator to generate 5 distinct random
Integers between 1 and 268, and to use these to select a simple random sample of 5 words
from the Gettysburg Address. Have students enter their results in Table 3.1 along with the
corresponding words from the Gettysburg Address and the length of each word as illustrated
below:

Statistics Teacher/STatistics Education Web: Online Journal of K-12 Statistics Lesson Plans 10
https://www.statisticsteacher.org/ or http://www.amstat.org/education/stew/
Contact Author for permission to use materials from this lesson in a publication
Table 3.1 – Random Sample of 5 Words/Sample 3
Random Integer
Selected Word
Length of Word
7
o
ur
3
45
a
ny
3
167
r
ather
6
201
b
efore
6
254 of
2
Total
20
Analyze Data and Interpret Results
13. Have each student compute the mean for their sample. (The mean for the data in Table
3.1 is 20/5 = 4.0 characters). Using a sheet from a Large Gridded Pad have each student
place a “sticky dot” on the plot (Dotplot 3.1) as close as possible over their sample mean
to create a dotplot displaying the sample means for the entire class. Students having the
same mean should stack one dot above another.
Have students compare the results displayed in Dotplot 2.2 (Means from samples of size
10) and Dotplot 3.1 (Means from samples of size 5). Results will vary class to class.
Hypothetical dotplots for a class of 30 students are shown below:
Means for Random Samples of Size 10 (Sample 2/Dotplot 2.2) and
Means for Random Samples of Size 5 (Sample 3/Dotplot 3.1)
How do these two distributions compare? For example, the displays above are both fairly
symmetrical and centered around 4.3 (the population mean). The major difference
between the two groups is that there is more variability in the sample means for samples
of size 5 than there is in the variability in the sample means for samples of size of 10.
Also, a range of typical values for a sample mean from samples of size 10 is 2.9 to 5.6
versus a range of 2.6 to 6.2 for a sample mean from samples of size 5. Thus, larger
sample sizes result in a narrower range of typical values.
Part 3 of this lesson illustrates an important relationship between sample size and how close a
sample mean is to the population mean – with simple random samples, the larger the sample size,
the closer sample means tend to be to the population mean.

Statistics Teacher/STatistics Education Web: Online Journal of K-12 Statistics Lesson Plans 11
https://www.statisticsteacher.org/ or http://www.amstat.org/education/stew/
Contact Author for permission to use materials from this lesson in a publication
Summary
When sampling words from the Gettysburg Address, self-selected samples tend to over-represent
longer words when compared to how often they occur in the population. This phenomenon
occurred even though we were able to see the entire population, which is uncommon when
sampling in statistics. Using simple random sampling tends to produce samples that are
representative of the population. While the sample mean may not be the same as the population
mean, we expect the sample mean to within a range of values centered around the population
mean. Larger simple random samples tend to produce sample means closer to the population
mean.
Attached Materials
•
Student handouts
o
The last two pages of the document provide a list of the words in the Gettysburg
Address. There are 268 words, and each word is assigned a number, 001 to 268.
References
Franklin, C., Kader, G., Mewborn, D., Moreno, J., Peck, R., Perry, M., and Scheaffer, R. (2005),
Guidelines for Assessment and Instruction in Statistics Education (GAISE) Report: A Pre-K–12
Curriculum Framework, Alexandria, VA: American Statistical Association.
Kader, G. and Jacobbe, T. (2013), Developing Essential Understanding of Statistics for Teaching
Mathematics in Grades 6-8, Reston, VA: National Council of Teachers of Mathematics.
