
Wildlife Accident Reduction
Study and Monitoring:
Arizona State Route 64
Final Report 626
November 2012
Arizona Department of TransportaƟon
Research Center
WildlifeAccidentReductionStudy
andMonitoring:
ArizonaStateRoute64
FinalReport626
November2012
Preparedby:
NorrisL.Dodd,Jeffre yW.Gagnon,ScottSprague,
SusanBoe,andRaymondE.Schweinsburg
ArizonaGameandFishDepartment
5000W.CarefreeHwy.
Phoenix,AZ85068
Preparedfor:
ArizonaDepartmentofTransportation
incooperationwith
U.S.DepartmentofTransportation
FederalHighwayAdministration
ThisreportwasfundedinpartthroughgrantsfromtheFederalHighwayAdministration,
U.S.DepartmentofTransportation.Thecontentsofthisreportreflecttheviewsofthe
authors,whoareresponsibleforthefactsandtheaccuracyofthedata,andfortheuse
oradaptationofpreviouslypublishedmaterial,presentedherein.Thecontentsdonot
necessarilyreflecttheofficialviewsorpoliciesoftheArizonaDepartmentof
TransportationortheFederalHighwayAdministration,U.S.Departmentof
Transportation.Thisreportdoesnotconstituteastandard,specification,orregulation.
Tradeormanufacturers’namesthatmayappearhereinarecitedonlybecausetheyare
consideredessentialtotheobjectivesofthereport.TheU.S.governmentandtheState
ofArizonadonotendorseproductsormanufacturers.

Technical Report Documentation Page
1. Report No.
FHWA-AZ-12-626
2. Government Accession No.
3. Recipient’s Catalog No.
4. Title and Subtitle
Wildlife Accident Reduction Study and Monitoring:
Arizona State Route 64
5. Report Date
November 2012
6. Performing Organization Code
7. Authors
Norris L. Dodd, Jeffrey W. Gagnon, Scott C. Sprague, Susan Boe,
and Raymond E. Schweinsburg
8. Performing Organization Report No.
9. Performing Organization Name and Address
Arizona Game and Fish Department
Research Branch
5000 W. Carefree Hwy.
Phoenix, AZ 85068
10. Work Unit No.
11. Contract or Grant No.
SPR-000-1(171)626
12. Sponsoring Agency Name and Address
Arizona Department of Transportation
Research Center, 206 S. 17th Ave., MD075R
Phoenix, AZ 85007
ADOT Project Manager: Estomih Kombe, Ph.D., PE
13.Type of Report & Period Covered
Final Report
14. Sponsoring Agency Code
15. Supplementary Notes
Prepared in cooperation with the U.S. Department of Transportation Federal Highway Administration
16. Abstract
The research team assessed elk (Cervus elaphus), mule deer (Odocoileus hemionus), and pronghorn (Antilocapra
americana) movements and vehicle collision patterns from 2007 through 2009 along a 57 mi stretch of State Route
(SR) 64 to develop strategies to improve highway safety and wildlife permeability. This study followed the SR 64 2006
Final Wildlife Accident Reduction Study that recommended nine wildlife passage structures and further monitoring to
determine the best locations for passage structures and fencing. Research objectives were to:
Assess wildlife movements, highway crossing patterns, and permeability across SR 64.
Assess relationships of wildlife crossings and distribution to vehicular traffic volume.
Investigate wildlife-vehicle collision spatial and temporal incidence and patterns.
Determine use of Cataract Canyon Bridge by wildlife for below-grade passage.
Develop recommendations to enhance highway safety and wildlife permeability.
The team tracked 23 elk, 11 deer, and 15 pronghorn with Global Positioning System (GPS) receiver collars, yielding
mean passage rates of 0.44, 0.54, and 0.004 crossings/approach, respectively. In total, 167 wildlife-vehicle collisions
were analyzed. Traffic volume influenced permeability and wildlife-vehicle collision patterns. The team recommended
11 passage structures, including Cataract Canyon Bridge, which had modest current wildlife use, along with wildlife
fencing to reduce collisions and promote permeability for elk, deer, and pronghorn.
17. Key Words
Elk, GPS telemetry, fencing, highway impact, mule deer,
permeability, pronghorn, traffic volume, wildlife passage
structures, wildlife accident reduction, wildlife-vehicle
collisions
18. Distribution Statement
This document is available to the U.S.
public through the National Technical
Information Service, Springfield,
Virginia 22161
23. Registrant’s Seal
19. Security Classification
Unclassified
20. Security Classification
Unclassified
21. No. of Pages
111
22. Price

TABLE OF CONTENTS
1.0 INTRODUCTION ................................................................................................... 3
2.0 LITERATURE REVIEW ........................................................................................ 9
2.1 Background .....................................................................................................9
2.2 Research Justification ....................................................................................12
2.3 Research Objectives ......................................................................................16
3.0 Study Area ............................................................................................................. 17
3.1 Natural Setting ...............................................................................................17
3.1.1 Climate ............................................................................................ 17
3.1.2 Vegetation ....................................................................................... 19
3.1.3 Wildlife Species .............................................................................. 19
3.1.4 Cataract Canyon Bridge .................................................................. 21
3.2 Traffic Volume ..............................................................................................22
4.0 Methods.................................................................................................................. 25
4.1 Wildlife Capture, GPS Telemetry, and Data Analysis ..................................25
4.1.1 Elk Capture ..................................................................................... 25
4.1.2 Mule Deer Capture .......................................................................... 25
4.1.3 Pronghorn Capture .......................................................................... 25
4.1.4 GPS Analysis of Animal Movements ............................................. 27
4.1.5 Calculation of Crossing and Passage Rates .................................... 27
4.1.6 Calculation of Pronghorn Approaches ............................................ 29
4.1.7 Calculation of Weighted Crossings and Approaches...................... 30
4.2 Traffic Volume and Animal Distribution Relationships ...............................30
4.3 Wildlife-Vehicle Collision Relationships .....................................................31
4.4 Wildlife Use of Cataract Canyon Bridge ......................................................31
4.5 Identification of Passage Structure Sites .......................................................33
5.0 Results .................................................................................................................... 37
5.1 Wildlife Capture, GPS Telemetry, and Data Analysis ..................................37
5.1.1 Elk Capture, Movements, and Highway Permeability .................... 37
5.1.2 Mule Deer Capture, Movements, and Highway Permeability ........ 41
5.1.3 Pronghorn Capture, Movements, and Highway Approaches .......... 42
5.2 Traffic Relationships .....................................................................................46
5.2.1 Elk-Traffic Relationships ................................................................ 46
5.2.2. Mule Deer–Traffic Relationships ................................................... 46
5.2.3. Pronghorn-Traffic Relationships .................................................... 51
5.3. Wildlife-Vehicle Collision Relationships .....................................................51
5.4 Wildlife Use of Cataract Canyon Bridge ......................................................58
5.5 Identification of Passage Structure Sites .......................................................59
5.5.1 Passage Structure Recommendations by Highway Section ............ 64
6.0 Discussion .............................................................................................................. 69
6.1 Wildlife Permeability ....................................................................................69
6.2 Wildlife Distribution and Traffic Relationships ............................................71
6.3 Wildlife-Vehicle Collision Relationships .....................................................72
6.4 Cataract Canyon Bridge Wildlife Use ...........................................................74
6.5 Identification of Passage Structure Sites .......................................................75
6.5.1 Passage Structure Design Considerations ....................................... 75
6.5.2 Role of Passage Structure Spacing ................................................. 79
6.5.3 Role of Fencing ............................................................................... 79
7.0 Conclusions and Recommendations ...................................................................... 83
7.1 Final Wildlife Accident Reduction Study Role .............................................83
7.2 Wildlife Permeability and Passage Structures ..............................................84
7.2.1 Elk and Mule Deer Permeability ..................................................... 84
7.2.2 Pronghorn Permeability .................................................................. 85
7.3 Impact of Traffic and Noise ..........................................................................86
7.4 Passage Structure Design and Placement ......................................................86
7.4.1 Role of Passage Structure Spacing ................................................. 87
7.4.2 Role of Fencing ............................................................................... 87
7.5 Highway Safety and Wildlife-Vehicle Collisions .........................................88
7.6 Monitoring .....................................................................................................89
References ......................................................................................................................... 91
LIST OF FIGURES
Figure 1. Landownership, Mileposts, 0.1 mi Segments, Highway Sections
A–E, and Preliminary Wildlife Passage Structures in the SR 64
Study Area Identified by the Final Wildlife Accident Reduction
Study (ADOT 2006). ................................................................................ 15
Figure 2. Great Basin Conifer Woodland Adjacent to SR 64 (Top) with
Open to Dense Stands of Pinyon and Juniper and Cliffrose, Apache
Plume, and Other Shrubs, and Plains and Great Basin Grasslands
(Bottom) Dominated by Blue and Black Grama, Galleta, and
Needle-and-Thread Grasses. ..................................................................... 18
Figure 3. Density Distributions for the Three Target Species of Research
along SR 64: Elk (Left), Mule Deer (Center), and Pronghorn
(Right). ...................................................................................................... 20
Figure 4. Cataract Canyon Bridge on SR 64. ........................................................... 21
Figure 5. Hourly Traffic Volume (Vehicles per Hour) along SR 64, Arizona,
from 2007 through 2009. Note the Low Volume of Traffic during
Nighttime Hours (00:00–04:00). ............................................................... 23
Figure 6. Photographs of Capture Techniques Used for Elk, Mule Deer and
Pronghorn along SR 64 and GPS-Collared Animals: Elk Captured
with Net-Covered Clover Trap (Top), Darting to Immobilize Mule
Deer (Middle), and Net-Gunning of Pronghorn from a Helicopter
(Bottom). ................................................................................................... 26
Figure 7. GPS Locations and Lines between Successive Fixes to Determine
Highway Approaches and Crossings in 0.10 mi Segments. The
Expanded Section Shows GPS Locations and Lines between
Successive Fixes to Determine Approaches to the Highway
(Shaded Band) and Crossings. Example A Denotes an Approach
and Crossing; Example B Denotes an Approach without a
Crossing. ................................................................................................... 29
Figure 8. Reconyx
™
Camera Mounted on a Wood Strip Glued to the
Concrete Surface of Each SR 64 Cataract Canyon Bridge Culvert
Cell to Monitor Wildlife Use. ................................................................... 32
Figure 9. Images of a Mule Deer Doe (Left) and Spike Bull Elk (Right)
Recorded by Reconyx
™
Cameras Mounted in the SR 64 Cataract
Canyon Bridge Culvert Cells. ................................................................... 32
Figure 10. SR 64 Crossings by GPS-Collared Elk along the Entire Study Area
(Top) and Sections A through E of the 2006 Final Wildlife
Accident Reduction Study and Enlarged to Show Crossings along
Sections D and E (Bottom). ...................................................................... 39
Figure 11. SR 64 Weighted Crossings by GPS-Collared Elk along the Entire
Study Area (Top) and Sections A through E of the 2006 Final
Wildlife Accident Reduction Study and Enlarged to Show Crossings
along Sections D and E (Bottom). ............................................................ 40
Figure 12. Mule Deer GPS Fixes along the SR 64 Study Area, as well as
Fixes for Two Deer Captured North of Flagstaff (Numbers 43 and
172). .......................................................................................................... 42
Figure 13. SR 64 Highway Crossings (Top) and Weighted Crossings
(Bottom) by GPS-Collared Mule Deer along Highway Section E
by 0.1 mi Segment. ................................................................................... 43
Figure 14. Highway Approaches (Top) and Weighted Approaches (Bottom)
Made to within 0.3 mi of SR 64 by GPS-Collared Pronghorn and
Sections A through E of the 2006 Final Wildlife Accident
Reduction Study. ....................................................................................... 45
Figure 15. Mean Probability That GPS-Collared Elk Occurred within 330 ft
Distance Bands along SR 64 at Varying Traffic Volumes. ...................... 48
Figure 16. Mean SR 64 Passage Rates by Two-Hour Time Blocks (Reflected
by the Midpoint of the Blocks) and Corresponding Mean Traffic
Volumes during Each Time Block for Elk (Bottom) and Mule Deer
(Top). ........................................................................................................ 49
Figure 17. Mean Probability That GPS-Collared Mule Deer Occurred within
330 ft Distance Bands along SR 64 at Varying Traffic Volumes. ............ 50
Figure 18. Mean Probability That GPS-Collared Pronghorn Occurred within
330 ft Distance Bands along SR 64 at Varying Traffic Volumes. ............ 52
Figure 19. Frequency of Elk and Mule Deer Collisions with Vehicles by
SR 64 Milepost from 2007 through 2009. ................................................ 53
Figure 20. Proportion of SR 64 Single-Vehicle Accidents by Milepost from
1998 through 2008 that Involved Wildlife. ............................................... 54
Figure 21. SR 64 Elk and Mule Deer Collisions with Vehicles by Time of
Day and Associated Traffic Volume. ........................................................ 55
Figure 22. SR 64 Elk and Mule Deer Collisions with Vehicles by Day and
Associated Traffic Volume. ...................................................................... 56
Figure 23. SR 64 Elk and Mule Deer Collisions with Vehicles by Month and
the Mean Traffic Volume. ......................................................................... 58
Figure 24. Ratings for 95 SR 64 0.6 mi Segments Using Wildlife Movement,
WVC Data, and Other Criteria to Determine the Location of
Potential Wildlife Passage Structures. Red Bars Denote Segments
Where Underpasses Were Recommended in the 2006 Final
Wildlife Accident Reduction Study and Orange Where Overpasses
Were Recommended (Table 9). The Green Bars Represent
Segments Where Additional Structures Are Recommended as a
Result of This Study.................................................................................. 61
Figure 25. Recommendations for SR 64 Wildlife Passage Structures and
Wildlife Fencing for Highway Section A (Left) and Section B
(Right). ...................................................................................................... 65
Figure 26. Recommendations for SR 64 Wildlife Passage Structures and
Wildlife Fencing for Highway Sections D and E. .................................... 66
Figure 27. Various Wildlife Passage Structure Options for SR 64, Including
CON/SPAN
®
Pre-Cast Concrete Arches for Overpasses, with a
Rendering of a Pronghorn Overpass on US 89 Integrated into Cut
Slopes (Top Left) and a Stand Alone Overpass on US 93 in
Montana (Top Right), Single-Span Bridged Underpasses Similar to
Those Used on SR 260 (Center), and Corrugated Multi-Plate Arch
Underpasses Used along US 93 in Montana (Bottom). ............................ 78
Figure 28. An Electrified Barrier Installed in the Pavement to Prevent
Wildlife from Breaching the Fenced Corridor at the Fencing
Terminus. This Mat was Installed on I-40 Off-Ramps in New
Mexico. ..................................................................................................... 81
LIST OF TABLES
Table 1. Vehicle Accidents Involving Collisions with Elk and Mule Deer
along SR 64 from 1991 through 2003, Including the Mean Number
of Collisions (per Year and per Mile). ...................................................... 13
Table 2. SR 64 Sections and Mileposts with Proposed Wildlife Mitigation
Measures for Focal Wildlife Species Identified in the 2006 Final
Wildlife Accident Reduction Study. ........................................................... 14
Table 3. Comparative Mean Values for GPS-Collared Animals by Species
Determined from GPS Telemetry along SR 64. ....................................... 38
Table 4. Mean Probabilities that GPS-Collared Elk, Mule Deer, and
Pronghorn Occurred within Distance Bands from SR 64 at Varying
Traffic Volumes. Documented from 2007 through 2009. ........................ 47
Table 5. WVCs Involving Elk and Mule Deer on SR 64 Sections from 2007
through 2009, including the Total Number and Mean Collisions
(per Mile). ................................................................................................. 51
Table 6. Frequency of Elk and Deer Collisions with Vehicles along SR 64
by Time Period. ......................................................................................... 57
Table 7. Frequency of Elk and Deer Collisions with Vehicles along SR 64
by Season. ................................................................................................. 57
Table 8. Number of Animals by Species that Entered and Successfully
Crossed through Cataract Canyon Bridge on SR 64, and Success
Rates. ......................................................................................................... 59
Table 9. Wildlife Passage Structure Locations along SR 64 by Milepost and
Highway Section and Types Recommended in the Various 2006
Final Wildlife Accident Reduction Study Alternatives and Those
Recommended as a Result of the Current Wildlife Movements
Study. ........................................................................................................ 63
ACRONYMS AND ABBREVIATIONS
AADT average annual daily traffic
ADOT Arizona Department of Transportation
AGFD Arizona Game and Fish Department
ATR automatic traffic recorder
BLM Bureau of Land Management
DPS Department of Public Service
ft foot or feet
GCNP Grand Canyon National Park
GMU Game Management Unit
GPS Global Positioning System
hr hour(s)
I-40 Interstate 40
MCP minimum convex polygon
mi mile(s)
MP milepost
mph miles per hour
NF National Forest
ROW right(s)-of-way
SDI Shannon diversity index
SE standard error
SR State Route
U.S. United States
US 89 U.S. Route 89
US 93 U.S. Route 93
US 180 U.S. Route 180
VHF very high frequency
WVC wildlife-vehicle collision
LIST OF SPECIES
Animals
Badger Taxidea taxus
Black bear Ursus americanus
Black-tailed jackrabbit Lepus californicus
Caribou Rangifer tarandus
Coyote Canis latrans
Desert cottontail rabbit Sylvilagus audubonii
Elk Cervus elaphus
Gray fox Urocyon cinereoargenteus
Grizzly bear Ursus arctos horribilis
Moose Alces alces
Mountain lion Puma concolor
Mule deer Odocoileus hemionus
Pronghorn Antilocapra americana
Raccoon Procyon lotor
Squirrel Spermophilus variegatus
Striped skunk Mephitis mephitis
White-tailed deer Odocoileus virginianus couesi
Wolf Canis lupus
Plants
Apache plume Fallugia paradoxa
Big sagebrush Artemisia spp.
Black grama Bouteloua eriopoda
Blue grama Bouteloua gracilis
Cliffrose Cowania mexicana
Galleta Pleuraphis jamesii
Gambel oak Quercus gambelii
Needle-and-thread grass Hesperostipa comata
One-seed juniper Juniperus monosperma
Pinyon Pinus edulis
Ponderosa pine Pinus ponderosa
Rabbitbrush Ericameria nauseosa
Winterfat Ceratoides lanata
ACKNOWLEDGMENTS
This project was funded by the Arizona Department of Transportation (ADOT) Research
Center and the Federal Aid Wildlife in Restoration Act, Project W-78-R, supporting
Arizona Game and Fish Department (AGFD) research. The research team commends
ADOT for its proactive commitment to promoting wildlife connectivity. The support of
the Federal Highway Administration, including former Environmental Project Manager
Steve Thomas, was instrumental to the funding and conduct of the project.
Many individuals at ADOT provided support and guidance in this project. The research
team commends Roadway Predesign Section for its commitment to developing
preliminary strategies for resolution of wildlife-highway conflicts. Estomih Kombe of the
ADOT Research Center provided project oversight and coordination. The team thanks
John Harper and Chuck Howe of the Flagstaff District for their tremendous support and
innovative management. Doug Eberline and Jennifer Toth of the Multimodal Planning
Division provided traffic data support. The team also thanks Todd Williams and Justin
White, of the Office of Environmental Services as well as Bruce Eilerts and Siobhan
Nordhaugen, formerly with the same office, for their commitment to the project and
overall efforts to address wildlife permeability.
AGFD Flagstaff Region personnel played a crucial role in supporting the project,
including Ron Sieg, Tom McCall, Carl Lutch, and David Rigo. The outstanding capture
support provided by Larry Phoenix was vital to the success of pronghorn capture and the
project. The research team also is indebted to the capable pilots of Papillion Helicopters.
Kari Ogren, Rob Nelson, and Chad Loberger of the AGFD Research Branch provided
invaluable field support, data collection, and analysis.
Highway patrol officers with the Arizona Department of Public Safety (DPS) Flagstaff
District made an outstanding effort to record all wildlife-vehicle collisions along State
Route (SR) 64. They collected and recorded information that was important to the
research project beyond what was required on accident reports. The research team is
particularly grateful to Matt Bratz for his coordination of accurate accident data
collection by DPS and his valuable input into the 2006 Wildlife Accident Reduction
Study.
The Kaibab National Forest (NF) provided invaluable logistical support during the
project. In particular, Jeffrey Waters provided project guidance and coordination, as well
as assistance with pronghorn capture.
The Arizona Antelope Foundation, the Rocky Mountain Elk Foundation, the Arizona Elk
Society, the Arizona Deer Association, and the Mule Deer Foundation were crucial in
helping to meet matching funding requirements for the project. Their interest and
commitment to efforts to promote wildlife permeability are sincerely appreciated.
The Technical Advisory Committee (TAC) provided many suggestions toward improving
the project’s effectiveness and applicability. Its tremendous support, oversight, and
commitment throughout the project are appreciated.
1
EXECUTIVE SUMMARY
The ADOT Research Center funded this study through a funding allocation from the
Federal Highway Administration (FHWA) State Planning and Research Program (SPR).
The Arizona Game and Fish Department was assigned the lead role in the execution of
the study and making recommendations based on the results. This partnership was made
possible with a joint project agreement (JPA) between the two state departments. The
study would concentrate on a 57 mile stretch of SR 64 beginning at the southern end,
which is the junction with Interstate 40. The focus would be a thorough evaluation of the
movement of elk, mule deer, and pronghorn in relation to highway and habitat
characteristics, traffic volumes, wildlife related accidents, and existing highway assets
like bridges.
The incidence of wildlife vehicle collisions along State Route 64 (SR 64) in Arizona has
been on the rise and thus a growing safety issue. Data collected over a ten year period
ending in 2008 showed 42 percent of single vehicle accidents in the study area involved
wildlife. The national average for wildlife related accidents is only five percent. In
addition, on a five mile stretch of highway at the north end of the study area wildlife
related accidents accounted for 75 percent of all single vehicle accidents.
Apart from the safety issue, good wildlife management means that we need to pay
attention to whether highway infrastructure may be creating a barrier to essential wildlife
movement within its habitat. In the long term, for wildlife to flourish, it is important that
man made barriers do not create scattered ‘islands’ of smaller and smaller animal
populations. Such an unintended segregation of wildlife populations has the potential to
result in diminished genetic strength and other weaknesses related to small numbers that
ultimately leads to a slow death for the affected species. It is therefore important that
efforts to address one issue (like wildlife vehicle collisions) are not done in a manner that
worsens the situation with respect to another important consideration. Solutions need to
be developed that strike a good balance between these needs.
What the Data Shows
For purposed of data collection and analysis, the designated length of highway for the
study was divided into small sections one tenth of a mile long. This would enable
researchers to clearly identify and chart out where within the proximity of the highway
animals were located or seen to make successful crossings. Monitoring of animal
movements was made possible by the use of Global Positioning System (GPS) collars on
animals. Successful crossings by an animal were identified when two consecutive
location coordinates for a collared animal matched locations on opposite sides of the
highway.
In addition to the use of GPS collars to monitor animal movement and highway
crossings, wildlife-vehicle collision data and traffic volume data were collected during
the study as well as from other sources. Relevant evaluations by other researchers in
prior years were also reviewed to see whether they were in agreement with or
2
contradicted any of our results. The evaluation attempted to establish relationships
between wildlife crossing levels and corresponding wildlife vehicle accidents and traffic
levels for different highway segments.
Analysis of the data established a positive relationship between wildlife crossing figures
and vehicle collisions for both elk and mule deer. No pronghorn crossings or
accidents/collisions were documented. It is thought that the highway may constitute
enough of a barrier that pronghorn will not venture to approach it. In comparison to
highway approach and crossing data seen for elk and deer in other locations like State
Route 260, the approach and crossing levels documented for SR 64 are considerably
lower. This is thought to be explained in part by the absence of attractive wet
meadow/riparian foraging habitat areas. Overall, high traffic volumes were associated
with lower wildlife (in this case elk and mule deer) approaches to and crossings of
highways. Where these high traffic volumes lasted only short durations, and thus could
be considered temporary, animals could be expected to return to habitat close to the
highway when the period of high traffic volume ended.
Summary of Conclusions and Recommendations
For some wildlife (like elk and mule deer), wildlife vehicle accident data can be
used reliably in the identification of locations where wildlife crossing assets can
make a big impact. When possible, GPS tracking is useful for supplemental data.
For animals like pronghorn which have a strong tendency to keep their distance
from busy highways, GPS tracking studies are crucial for collecting the data
necessary to identify potential solutions.
Measures to reduce noise and negative visual impacts near wildlife crossing
infrastructure have potential to enhance the effectiveness of these assets.
Passage structure designs should consider some important characteristics, some
specific to the main animal species of concern, noted in the report to maximize the
use of these assets.
Based on the full set of data collected and analyzed as part of this study, the
research team identified a total of eleven potential wildlife passage locations. As
opportunities arise, consideration should be made towards the implementation of
some underpasses/overpasses or the retrofitting of bridges as the case may be. The
specific details are provided for each of the potential locations.
For existing or future wildlife passage structures, having a length of appropriate
fencing to ‘channel’ animals to the point of crossing is an important part of
achieving maximum benefits from what is typically a sizeable infrastructure
investment.
3
1.0 INTRODUCTION
The research team assessed wildlife-highway relationships from 2007 through 2009 along
a 57 mile stretch of State Route (SR) 64, the highway linking Interstate 40 (I-40) and
Grand Canyon National Park (GCNP) in north-central Arizona. The incidence of
wildlife-vehicle collisions (WVCs) involving elk and mule deer along this stretch of
highway is a significant and growing concern, as is the ability of wildlife to cross the
highway corridor, or permeability. This predominately two-lane highway will be
reconstructed in the future to a four-lane divided highway to address growing traffic
volume and the incidence of WVCs. The average annual traffic volume on SR 64 was
4275 vehicles per day during the study period, but traffic levels at night were low,
averaging less than 10 vehicles per hour for a 4 hour period.
In a Final Wildlife Accident Reduction Study (1991–2003), the Arizona Department of
Transportation (ADOT) commissioned the development of a proactive assessment of
WVCs and potential mitigation measures to reduce the incidence of WVCs along
approximately 50 miles of SR 64 (185.5–235.4). This assessment (ADOT 2006)
recommended that nine passage structures be integrated into future highway
reconstruction of SR 64. It also recognized the need to conduct further field evaluation
and monitoring to determine the best locations for wildlife passage structures and the
extent of fencing needed to funnel animals to the structures.
The study called for assessing wildlife use of Cataract Canyon Bridge to determine
whether its design is conducive to wildlife passage. The assessment addressed the
potential barrier effect on pronghorn and recommended that this issue also be addressed
with monitoring. As a result of these recommendations, this research project was initiated
in 2007, with the following objectives:
Assess elk (June 2007 through October 2009), mule deer (April 2008 through
October 2009), and pronghorn (January 2008 through January 2009) movements,
highway crossing patterns, and distribution relative to SR 64 and determine
permeability across the highway corridor.
Investigate the relationships of elk, mule deer, and pronghorn highway crossing and
distribution patterns to SR 64 vehicular traffic volume (2007 through 2009).
Investigate WVC patterns and relationships to elk, mule deer, and pronghorn
movement and highway crossing patterns in relation to SR 64 (2007 through 2009).
Assess the degree to which Cataract Canyon Bridge is used by wildlife for below-
grade passage (July 2008 through December 2009).
Develop recommendations to enhance elk, mule deer, and pronghorn highway
permeability along SR 64 through the application of wildlife passage structures and
ungulate-proof fencing.
4
MOVEMENTS AND PERMEABILITY
The research team determined highway crossings and calculated the crossing and passage
rates for elk, mule deer, and pronghorn using Global Positioning System (GPS)
telemetry. Passage rates served as the team’s relative measure of highway permeability,
calculated as the number of times animals crossed SR 64 in proportion to the number of
times animals approached to within 0.15 mi. The research team tracked 23 elk fitted with
GPS collars and accrued 107,055GPS relocations. Elk crossed the highway 843 times, an
average of 0.12 times per day, with the highest proportion of crossings (60 percent)
occurring during the driest season (April–July).
Travel to limited water sources likely influenced movement and crossing patterns. The
elk passage rate averaged 0.44 crossings per approach, 52 percent lower than the rate
found during previous research on SR 260 sections with similar highway standards (Dodd
et al. “Evaluation of Measures,” 2007). The elk crossing distribution was not random and
exhibited several peak crossing zones, especially at the north end of the study area.
The research team tracked 11 mule deer fitted with collars and accrued 29,944GPS fixes.
Deer crossed SR 64 550 times, an average of 0.26 times per day—twice as frequently as
elk. Seasonal deer crossings were more consistent than seasonal elk crossings, though
46 percent of crossings occurred during late summer and fall (August–November). The
average deer passage rate was 0.54 crossings per approach, which was higher than the
rate for elk. The mule deer crossing distribution did not occur in a random fashion. It
exhibited two peak crossing zones at the north end of the study area, with 92 percent of
the crossings occurring along a 3.2 mile stretch between Grand Canyon Airport and the
GCNP, in the vicinity of Tusayan.
The research team tracked 15 pronghorn with GPS collars that amassed 56,433 GPS
fixes. Only a single GPS-collared pronghorn crossed SR 64 (three times), for a crossing
rate average of 0.001 crossings per day. The mean pronghorn passage rate was a
negligible 0.004 crossings per approach, indicating that SR 64 is a near total barrier to
pronghorn passage. Pronghorn approached the highway 4269 times, and the distribution
was not random. The approach distribution exhibited three peaks along SR 64, with the
largest peak near the south boundary of the Kaibab National Forest, north of Valle.
TRAFFIC RELATIONSHIPS
In cooperation with ADOT, the research team measured traffic volume using a permanent
automatic traffic recorder. The pattern of elk and mule deer distribution with fluctuating
traffic was consistent with published models that indicated reduced “habitat
effectiveness” near the highway.
The use of habitat within 990 ft of the highway, as measured by probability of presence
of all three species, was clearly reduced at higher traffic volumes. The mean proportion
for the three species occurring within 990 ft of SR 64 dropped nearly in half, from 0.34 at
less than 100 vehicles per hr to 0.19 at 200 to 300 vehicles per hour. However, elk and
deer returned to areas within 330 ft of the highway in proportions greater than 0.12 when
5
traffic volumes were low. The impact to habitat effectiveness for these two species thus
was temporary.
The highest levels of permeability for elk and deer (passage rates greater than
0.70 crossings per approach) occurred at night when traffic was lowest. Pronghorn, on the
other hand, are diurnal and are active when traffic is heaviest. Along SR 64, pronghorn
uniformly avoided habitats adjacent to the highway (within 330 ft), thus reflecting a
permanent loss in habitat effectiveness.
Peak daytime traffic volumes along SR 64 approach 10,000 vehicles per day, a volume
at which highways become strong barriers to wildlife passage. Pronghorn appeared more
sensitive to traffic volume impact than elk and deer, and their avoidance of the area
adjacent to the highway is problematic in terms of implementing effective passage
structures to promote permeability.
WILDLIFE-VEHICLE COLLISION RELATIONSHIPS
The incidence of WVCs along SR 64 is a growing highway safety issue, with an increase
in collisions from that documented in the 2006 Final Wildlife Accident Reduction Study
report (36.7 per year) to 52.0 per year during this study (ADOT 2006). The research team
recorded 167 WVCs, with elk accounting for 59 percent of the accidents and mule deer
accounting for 35 percent. SR 64 sections on Kaibab National Forest lands at the north
and south ends of the study area had the highest incidence of elk and deer collisions,
though the collision rate on the north end was more than twice the rate on the south end
near I-40. No WVCs involving pronghorn were recorded during the study.
The spatial association between WVCs and GPS-determined crossings at the 1.0 mi scale
was significant for elk and mule deer. From 1998 through 2008, 42 percent of all single-
vehicle accidents in the study area involved wildlife, compared with the national average
of just 5 percent. On the five miles at the north end of the study area, wildlife-related
accidents accounted for more than 75 percent of all single-vehicle accidents.
The observed frequency of elk-vehicle collisions by time of day was different from our
expectations, with the highest proportion of elk collisions (50 percent) recorded during
evening hours. There was a negative association between elk-vehicle collisions and
traffic volume by hour. Deer-vehicle collisions also varied by time of day, with 49
percent of accidents recorded during the evening. Accidents during the morning and
midday, when traffic volume was highest, accounted for 43 percent of deer-vehicle
collisions.
There was a significant difference in the observed versus expected frequency of elk-
vehicle collisions by season. The driest season of the year, early spring–summer (April–
July), accounted for 43 percent of all elk-vehicle collisions; late summer–fall accounted
for another 38 percent. The association between elk collisions and mean monthly traffic
volume was significant, which was not the case for deer. For mule deer, the incidence of
collisions was relatively constant through much of the year, except for the late summer–
fall season (August–November), when nearly half of all collisions occurred. The
6
association between highway crossings and collisions by month was significant for elk
and mule deer.
Using nationally accepted cost estimates associated with elk and mule deer collisions,
and based on 2007–2009 WVCs, the annual cost associated with SR 64 vehicle collisions
is estimated to be $612,513 for elk and $162,168 for deer, or a total of $774,681 per year;
over 20 years, the total cost from WVCs would exceed $15.5 million (Huijser et al.
2007).
CATARACT CANYON BRIDGE WILDLIFE USE
To quantify wildlife use of Cataract Canyon Bridge, the research team employed single-
frame cameras in each of the four box-culvert cells; these self-triggering cameras
provided infrared nighttime illumination to record animals crossing through the bridge at
night. In total, 126 wildlife images were recorded by cameras, including 13 elk and 37
mule deer. In addition to wildlife, substantial human presence was documented at the
bridge, with a total of 191 humans and 29 all-terrain vehicles passing under the structure.
Of the limited number of elk and mule deer that approached the bridge, 92 percent and
89 percent of these species, respectively, crossed through the bridge cells. The majority
(89 percent) of deer use occurred from August through October. Elk use occurred only in
October and December, with no approaches the rest of the year. Of all deer and elk bridge
crossings, 64 percent occurred in the 4 hr period between 11:00 p.m. and 3:00 a.m..
Though the documented wildlife use of the bridge was nominal, the research team’s
expectation for significant use was also low because wildlife fencing to limit at-grade
crossings and funnel animals to the bridge could not be accomplished as hoped. Despite
the limited wildlife use recorded on the cameras, the research team nonetheless believes
that the bridge has the potential to be a highly effective retrofitted wildlife passage
structure due to the comparatively high rates of mule deer and elk that crossed through
with minimal behavioral resistance.
The bridge exceeds all recommended structural and placement guidelines for effective
elk and mule deer passage structures. The high level of human use should not
significantly limit effective wildlife use of the structure because wildlife use occurs in the
evening and nighttime hours; human use occurs during daylight hours.
IDENTIFICATION OF PASSAGE STRUCTURE SITES
The research team used elk and mule deer highway crossings, WVCs, pronghorn
approaches, and the proportions of animals crossing or approaching within each segment,
among other criteria, to rate 95 0.6 mile segments for suitability as potential passage
structure locations, this 57 mile area extends into GCNP and included all areas where elk,
mule deer and pronghorn approached the highway and ranged outside of the area defined
by ADOT (2006). Additional criteria included land ownership and topography that
would support passage structure construction. The ratings ranged from 1 to 33 points on a
40-point scale and averaged 10.0 points per segment. The research team’s ratings
7
identified 11 priority wildlife passage structure locations; the 0.6 mile segments with
these structures averaged a 20.7 rating.
Six sites were conducive to underpasses, and five were at sites where the terrain was
conducive to overpasses and would promote pronghorn permeability. Of the nine wildlife
underpass locations identified in the 2006 Final Wildlife Accident Reduction Study report,
the research team’s rating of potential passage structure sites corroborated that eight were
warranted.
In addition to the passage structure sites recommended in the 2006 Final Wildlife
Accident Reduction Study report, which were based largely on WVC records and sites
where the topography could support a structure, the team identified three additional
passage structures. One of these was an underpass at the Kaibab National Forest–GCNP
boundary, and the other two structures are overpasses recommended for pronghorn
passage in an area where no WVC was recorded during this study or documented in the
2006 Final Wildlife Accident Reduction Study report.
A variety of passage structure types can be considered for use along SR 64, including the
single-span bridges used effectively along SR 260, cost-effective multi-plate arch
underpasses, and pre-cast concrete arches. The 11 structures recommended by the team
are spaced 1.5 to 2.3 mi apart, with this spacing generally consistent with guidelines for
elk and pronghorn.
The situation for pronghorn is very different from that for elk and deer. For pronghorn,
fencing in association with passage structures is not needed to preclude at-grade
pronghorn crossings, but it is important in providing a visual cue as to a path across the
highway barrier, provided no fencing is used at the mouth of the passages. For
pronghorn, minimizing the impact of high daytime traffic may be more critical than
fencing, especially given pronghorn avoidance of the habitats adjacent to SR 64. A
comprehensive set of measures to reduce traffic-associated impact could create “quiet
zones” along the highway corresponding to passage structures and could facilitate
pronghorn permeability.
Wildlife fencing plays an integral role with passage structures in achieving objectives for
reducing WVCs, promoting highway safety, and improving wildlife permeability,
especially for elk and deer. Failure to erect adequate fencing in association with passage
structures, even when spaced adequately, has been found to substantially reduce their
effectiveness. The research team identified a 14.2 mile section of the highway where
fencing would be needed to meet WVC reduction and permeability objectives.
8
9
2.0 LITERATURE REVIEW
2.1 BACKGROUND
Direct and indirect highway impacts have been characterized as some of the most
prevalent and widespread forces altering ecosystems in the United States (Noss and
Cooperrider 1994, Trombulak and Frissell 2000, Farrell et al. 2002). Forman and
Alexander (1998) estimated that highways have affected more than 20 percent of the
nation’s land area through habitat loss and degradation.
It is estimated that as many as 1.5 million collisions involving deer occur annually in the
United States (Conover 1997). Wildlife-vehicle collisions (WVCs) cause human injuries,
deaths, and tremendous property loss (Reed et al. 1982, Schwabe and Schuhmann 2002).
More than 38,000 human deaths attributable to WVCs occurred in the United States from
2001 through 2005, and the economic impact exceeds $8 billion a year (Huijser et al.
2007). The most pervasive impacts of highways on wildlife, however, are the barrier and
fragmentation effects resulting in diminished habitat connectivity (Noss and Cooperrider
1994, Forman and Alexander 1998, Forman 2000).
Highways block animal movements between seasonal ranges or other vital habitats.
This barrier effect fragments habitats and populations, reduces genetic interchange
(Gerlach and Musolf 2000, Epps et al. 2005, Riley et al. 2006), and limits dispersal of
young (Beier 1995), all disrupting viable wildlife population processes. Long-term
fragmentation and isolation renders populations more vulnerable to the influences of
catastrophic events and may lead to extinctions (Hanski and Gilpin 1997). Fencing that
blocks wildlife and livestock access across highways without provisions for adequate
passage may exacerbate barrier effects.
Though numerous studies have alluded to highway barrier effects on wildlife
(e.g., Forman et al. 2003), relatively few have provided quantitative data relative to
animal passage rates. Most studies have focused on the efficacy of passage structures in
maintaining wildlife permeability, the ability of animals to pass across highways
(Clevenger and Waltho 2003, Ng et al. 2004). Assessments of highway fragmentation
effects on relatively small, less mobile mammals (Swihart and Slade 1984, Conrey and
Mills 2001, McGregor et al. 2003) have proved easier to accomplish than assessments for
larger, more mobile species that are limited by cost-effective techniques to measure
permeability.
Paquet and Callaghan (1996) used winter track counts adjacent to highways and other
barriers to determine passage rates by wolves. Very high frequency (VHF) radio
telemetry has also been used to assess wildlife movements and responses to highways,
often pointing to avoidance of highways and roads (Brody and Pelton 1989, Rowland
et al. 2000).
Only a limited number of studies have addressed permeability in an experimental
(e.g., before and after construction) context with research controls (Hardy et al. 2003;
Roedenbeck et al. 2007; Olsson 2007; Dodd et al., “Evaluation of Measures,” 2007).
10
Olsson (2007) documented an 89 percent decrease in the mean moose-crossing rate
between before- and after-reconstruction levels along a highway in Sweden. Dyer et al.
(2002) compared actual road to simulated road network crossing rates, where caribou
crossed actual roads less than 20 percent as frequently as simulated networks.
Dodd et al. (“Assessment of elk,” 2007) stressed the value of a quantifiable and
comparable metric of permeability. They calculated elk highway passage rates from
Global Positioning System (GPS) telemetry to conduct before-after-control
reconstruction comparisons along SR 260. Dodd et al. (“Effectiveness of Wildlife,” in
review) reported that overall elk (n = 100) passage rates averaged 0.50 crossings per
approach. Among reconstruction classes, the mean elk passage rate for the before-
reconstruction control class (0.67) was 39 percent higher than the mean after-
reconstruction passage rate (0.41). They also calculated white-tailed deer passage rates
along SR 260; the rates averaged only 0.03 crossings per approach on control sections.
On reconstructed sections with passage structures, the passage rate was significantly
higher (0.16 crossings per approach).
Along United States Route 89 (US 89), Dodd et al. (“Effectiveness of Wildlife,” in
review) used the same consistent methodology and found the mean pronghorn (n = 31)
passage rate to be negligible—0.006 crossings per approach. US 89 constitutes a near-
total barrier to pronghorn passage.
In addition to the permeability insights gained from the previously discussed GPS
telemetry studies, the SR 260 and US 89 studies furthered the understanding that traffic
volume plays in the highway barrier effect. Theoretical models (Mueller and Berthoud
1997) suggest that highways averaging 4000 to 10,000 vehicles per day present strong
barriers to wildlife and would repel animals from the highway. Gagnon et al. (“Traffic
volume alters,” 2007) found that increasing vehicular traffic volume decreased the
probability of at-grade crossings by elk, which shifted their distribution away from the
highway with increasing traffic volume, consistent with Mueller and Berthoud (1997) and
Jaeger et al. (2005).
For white-tailed deer, Dodd and Gagnon (2011) found that at-grade SR 260 passage rates
were consistently low (fewer than 0.1 crossing per approach) across all traffic volumes.
Pronghorn also were consistently negatively impacted by traffic volume, even at low
levels, and distribution remained constant among all distances from US 89 and across all
traffic volumes up to 500 vehicles per hr (Dodd et al. “Effectiveness of Wildlife,” in
review). Whereas elk and deer highway crossings occur at night when traffic volume is
lowest, pronghorn are diurnal and active when traffic volumes are typically at their
highest (Gagnon et al. “Traffic volume alters,”2007) contributing to their low
permeability.
Collectively, these Arizona studies using consistent, comparable methodologies and
metrics have added substantially to the understanding of highway impact to wildlife
permeability and traffic volume relationships for multiple species and highways
exhibiting different traffic patterns. This understanding will further benefit from
continued studies that assess permeability for additional species and on highways that

11
expand the range of experimental conditions under which permeability is assessed
(Jaeger et al. 2005).
Numerous assessments of WVC patterns have been conducted, most focusing on deer
(Reed and Woodward 1981, Bashore et al. 1985, Romin and Bissonette 1996, Hubbard et
al. 2000). Only recently have WVC assessments specifically addressed elk-vehicle
collision patterns (Gunson and Clevenger 2003, Biggs et al. 2004, Dodd et al.
“Effectiveness of Wildlife,” in review, Gagnon et al. 2010). Insights gained from such
assessments have been instrumental in developing strategies to reduce WVCs
(Romin and Bissonette 1996, Farrell et al. 2002), including planning passage structures
to reduce at-grade crossings and to maintain permeability (Clevenger et al. 2002).
Consistent tracking of WVCs constitutes a valuable tool to assess the impact of highway
construction (Romin and Bissonette 1996) and the efficacy of passage structures and
other measures (e.g., fencing) in reducing WVCs (Reed and Woodard 1981, Ward 1982,
Clevenger et al. 2001, Dodd et al., “Evaluation of Measures,” 2007).
Increasingly, structures designed to promote wildlife passage across highways are being
implemented throughout North America, especially large bridges (e.g., underpasses or
overpasses) designed specifically for large animal passage (Clevenger and Waltho 2000,
Bissonette and Cramer 2008). Whereas early passage structures were typically
approached as single-species mitigation measures to address WVCs (Reed et al. 1975),
the focus today is more on preserving ecosystem integrity and landscape connectivity
benefiting multiple species (Clevenger and Waltho 2000).
Transportation agencies are increasingly receptive to integrating passage structures into
highways to address safety and ecological needs (Farrell et al. 2002). At the same time,
there is increasing expectation that such structures will benefit multiple species and
enhance connectivity (Clevenger and Waltho 2000), and that scientifically sound
monitoring of wildlife response to these measures will occur to improve effectiveness
(Clevenger and Waltho 2003, Hardy et al. 2003). Corlatti et al. (2009) argued for long-
term monitoring of wildlife passages to evaluate their effectiveness in maintaining
connectivity and promoting population and genetic viability, thus justifying their
relatively high cost.
Wildlife passage structures have indeed shown benefit in promoting wildlife passage for
a variety of wildlife species (Farrell et al. 2002; Clevenger and Waltho 2003; Dodd et al.,
“Assessment of elk,” 2007; Gagnon et al. 2011). Dodd et al. (“Evaluation of Measures,”
2007) found that elk passage rates along one section of SR 260 increased 52 percent to
0.81 crossings per approach once reconstruction was completed and ungulate-proof
fencing linking passage structures was erected. This pointed to the efficacy of passage
structures and fencing in promoting permeability, as well as achieving an 85 percent
reduction in elk-vehicle collisions (Dodd et al., “Evaluation of Measures,” 2007).
Gagnon et al. (“Effects of traffic,” 2007) found that traffic levels did not influence elk
passage rates during below-grade underpass crossings. This finding shows the benefit
of underpasses and fencing in promoting permeability by funneling elk to underpasses
12
where traffic has minimal effect compared with crossing at-grade during high traffic
volumes (Gagnon et al. “Traffic volume alters,”2007). The fivefold higher white-tailed
deer permeability along SR 260 after reconstruction with passage structures compared
with controls suggests the efficacy of passage structures; like elk, deer passage rates were
minimally affected by traffic on sections where passage structures facilitated below-grade
passage (Dodd and Gagnon 2011).
Structural characteristics and placement of wildlife crossing structures are important to
maximizing wildlife use (Reed et al. 1975; Foster and Humphrey 1995; Clevenger and
Waltho 2000, 2003; Dodd et al., “Evaluation of Measures,” 2007; Gagnon et al. 2011).
Prior studies modeled structural factors accounting for differences in wildlife use
(Clevenger and Waltho 2000, 2005; Ng et al. 2004). Gagnon et al. (2011) assessed five
factors, of which structural design and placement characteristics had the greatest
influence on elk use of SR 260 underpasses. However, given sufficient time for
habituation, most structures became equally effective for elk, even in spite of structural
or placement limitations.
The spacing between passage structures is also an important consideration (Bissonette
and Adair 2008). Dodd et al. (“Effectiveness of Wildlife,” in review) and Gagnon et al.
(2010) found considerable variation in mean elk passage rates (ranging from 0.09 to
0.81 crossings per approach) on three reconstructed SR 260 sections, likely reflecting the
corresponding variation in passage structure spacing ranging from 1.5 to 0.6 miles, with a
strong negative association with increased distance between structures (r = -0.847;
Dodd et al. “Effectiveness of Wildlife,” in review). Bissonette and Adair (2008) assessed
recommended passage structure spacing for several species tied to isometric scaling of
home ranges to define appropriate passage structure spacing distance. They
hypothesized that when used with other criteria this approach will help maintain
landscape permeability for a range of species.
Most assessments of wildlife passage structure use have been for newly constructed
structures implemented as part of major highway reconstruction projects (Clevenger and
Waltho 2000, 2005; Gagnon et al. 2011). However, some assessments have been of
primarily drainage structures retrofitted to serve as wildlife passage structures with the
erection of fencing to limit at-grade crossings and funnel animals to structures
(Gordon and Anderson 2003, Ng et al. 2004).
In Arizona, such retrofitting has considerable promise as a cost-effective approach to
minimizing WVCs and promoting permeability (Gagnon et al. 2010), particularly
compared with costly highway reconstruction that may not occur on some highways for
decades. As such, there is a need to better understand the potential effectiveness of
existing structures for retrofitting applications, including structural design characteristics
that may limit effectiveness.
2.2 RESEARCH JUSTIFICATION
The incidence of WVCs along SR 64 between I-40 and GCNP is a significant and
growing concern. In the future, this predominantly two-lane highway will be

13
reconstructed to a four-lane divided highway to address growing traffic volume and the
incidence of WVCs.
To help address the WVC issue, ADOT commissioned the development of a proactive
assessment of WVCs and potential mitigation measures to reduce their incidence along
SR 64. In ADOT (2006) it was reported that 48 percent of 475 accidents recorded along
SR 64 in the five-year period from October 1998 through September 2003 involved
collisions with wildlife, primarily elk and mule deer (Table 1). This study developed and
evaluated alternatives and associated mitigation measures for consideration in the
planned feasibility study for the eventual reconstruction of SR 64.
Table 1. Vehicle Accidents Involving Collisions with Elk and Mule Deer
along SR 64 from 1991 through 2003, Including the Mean Number
of Collisions (per Year and per Mile).
SR 64
section
Elk-vehicle accidents
Mule deer-vehicle
accidents
Mileposts Total
Mean
(per
year)
Mean
(per
mile)
Total
Mean
(per
year)
Mean
(per
mile)
A
185.5–204.7
(19.2 mi)
58 4.5 3.0 79 6.1 4.1
B
204.7–212.5
(7.8 mi)
2 0.2 0.3 2 0.2 0.3
C
212.5–214.3
(1.8 mi)
0 0.0 0.0 1 0.1 0.6
D
214.3–223.4
(9.1 mi)
6 0.5 0.7 3 0.2 0.3
E
223.4–235.4
(12.0 mi)
97 7.5 8.1 238 18.3 19.8
All
185.5–235.4
(49.9 mi)
163 12.5 3.3 315 24.2 6.3
Source: Final Wildlife Accident Reduction Study (ADOT 2006)
The earlier study report (ADOT 2006) delineated five SR 64 sections (A–E) based on
land ownership and habitat (Figure 1). This study developed two mitigation alternatives
for three of the sections (Table 2) to address the past incidences of WVCs, including the
construction of as many as seven wildlife underpasses and three overpasses, depending
on the selected alternatives (Table 2; Figure 1). None of the passage structures were
recommended along highway sections where American pronghorn were a focus (Sections
B and D), partly because no WVC involving this species was recorded from 1991
through 2003. However, SR 64 likely constitutes a significant barrier to pronghorn
passage similar to US 89 to the east, where no pronghorn-vehicle collisions were
recorded either (Dodd et al. 2011).

14
Table 2. SR 64 Sections and Mileposts with Proposed Wildlife Mitigation Measures for
Focal Wildlife Species Identified in the 2006 Final Wildlife Accident Reduction Study.
SR 64
section
Mileposts
Mitigation
alternative
Proposed wildlife
mitigation measures
Focal
wildlife
species
Underpass Overpass Fencing
A
185.5–204.7
(19.2 mi)
A(W)-1
A(W)-2
2
a
1
a
0
1
Yes
Yes
Elk, mule
deer
B
204.7–212.5
(7.8 mi)
None 0 0 No Pronghorn
C
212.5–214.3
(1.8 mi)
None 0 0 No
None;
human
develop-
ment
D
214.3–223.4
(9.1 mi)
D(W)-1
D(W)-2
1
0
0
1
Yes
Yes
Elk,
mule deer,
pronghorn
E
223.4–235.4
(12.0 mi)
E(W)-1
E(W)-2
4
4
0
1
Yes
Yes
Elk,
mule deer
a
Includes Cataract Canyon Bridge, which will be used as a passage structure
The same study (ADOT 2006) identified the need to conduct further field evaluation and
monitoring to determine the best locations for wildlife passage structures and the extent
of ungulate-proof fencing needed to funnel animals to passage structures. The report
indicated that the focus of such monitoring should be from mile post (MP) 222.0 to MP
235.4, where the highest incidence of WVCs involving elk and mule deer has occurred in
the past.
The report called for the monitoring of current and potential (e.g., with added funnel
fencing) wildlife use of Cataract Canyon Bridge at MP 187.3; Section A to determine
whether this multiple box culvert design is conducive to wildlife passage.
The report also addressed the potential barrier effect to pronghorn (especially along
Section B) and recommended that this issue also be further evaluated with monitoring. In
that report it was also recommended that a cooperative research project between ADOT
and the AGFD be initiated in advance of the feasibility study and final design for
highway reconstruction such that refined, site-specific information can be incorporated
into the final reconstruction plans.

15
Figure 1. Landownership, Mileposts, 0.1 mi Segments, Highway Sections A–E,
and Preliminary Wildlife Passage Structures in the SR 64 Study Area Identified by the
Final Wildlife Accident Reduction Study (ADOT 2006).
16
In 2007, an interagency agreement between ADOT and the AGFD was executed for the
SR 64 research project (Project JPA07-026T), with funding provided by the ADOT
Research Center. This research project is significant from several perspectives.
The cited study (ADOT 2006) conducted for SR 64 represents the first assessment of its
type in Arizona, forming the proactive basis from which to develop strategies to mitigate
WVCs and obtain refined information with further monitoring and research.
The project also reflects the incremental process in addressing wildlife connectivity and
permeability needs embodied in Arizona’s Wildlife Linkages Assessment (Arizona
Wildlife Linkages Workgroup 2006). General connectivity needs identified in the
assessment (e.g., Linkage No. 12; Coconino Plateau–Kaibab National Forest) were also
addressed in the 2006 Final Wildlife Accident Reduction Study, which called for further
monitoring to assess site-specific needs and refined strategies for promoting permeability.
2.3 RESEARCH OBJECTIVES
Pursued largely as a result of the 2006 Final Wildlife Accident Reduction Study, this
research project will add considerably to the understanding of wildlife movements in
relation to highways and provide information to support data-driven design planning for
the planned reconstruction of SR 64. Focusing on elk, mule deer, and pronghorn, this
research project complements previous research on wildlife-highway permeability, traffic
volume, and WVC relationships (Dodd et al. “Effectiveness of Wildlife,” in review,
2011; Gagnon et al. “Traffic volume alters,” 2007). The specific research objectives of
this research project were to:
Assess elk (June 2007 through October 2009), mule deer (April 2008 through
October 2009), and pronghorn (January 2008 through January 2009) movements,
highway crossing patterns, and distribution relative to SR 64 and determine
permeability across the highway corridor.
Investigate the relationships of elk, mule deer, and pronghorn highway crossing and
distribution patterns to SR 64 vehicular traffic volume (2007 through 2009).
Investigate WVC patterns and relationships to elk, mule deer, and pronghorn
movement and highway crossing patterns in relation to SR 64 (2007 through 2009).
Assess the degree to which Cataract Canyon Bridge is used by wildlife for below-
grade passage (July 2008 through December 2009).
Develop recommendations to enhance elk, mule deer, and pronghorn highway
permeability along SR 64 through the application of wildlife passage structures and
ungulate-proof fencing.
17
3.0 STUDY AREA
SR 64 is the highway connecting I-40 to Grand Canyon National Park (GCNP). It is
classified as a rural principal arterial highway. The focus of this research project was a
57 mile stretch of highway starting at I-40, approximately 2 miles east of Williams (MP
185.5), and ending at the GCNP boundary (MP 237.0) just north of the community of
Tusayan, Coconino County, Arizona (latitude 35º25'–35º99'N, longitude 112º12'–
112º15'W; Figure 1). SR 64 runs north–south and intersects US 180 at Valle (MP 213.5);
US 180 links SR 64 to Flagstaff, 40 miles to the southeast. The majority of SR 64 now is
a two-lane highway, with occasional passing lanes.
3.1 NATURAL SETTING
The study area is at the southwest extent of the Colorado Plateau physiographic province.
The south half of the study corridor lies within the San Francisco Peaks Volcanic Field
(Hansen et al. 2004). The study corridor adjacent to SR 64 varies in elevation from
6000 ft between Red Lake and Valle to 6930 ft at the south end of the study area near
Kaibab Lake, and 6600 ft elevation at Grand Canyon Airport in Tusayan. The topography
is a mix of mesas, cinder cones, and broken terrain with rolling hills, ridges, and valleys
interspersed with large, relatively flat grassland areas (Figures 1 and 2).
Land ownership adjacent to the highway includes U.S. Forest Service (Kaibab NF) lands
(35 percent of the corridor), including 5 miles at the south end and 13 miles at the north
end of the study area (Figure 1). In between, land ownership is a mix of interspersed
Arizona State Trust (25 percent) and private lands (40 percent), with much of the private
land subdivided for development (Figure 1). Existing development is concentrated near
the communities of Red Lake, Valle, and Tusayan (Figure 1).
3.1.1 Climate
Generally, the climate is characterized as semiarid, dominated by hot summers and cool
winters. At the south and north ends of the study area, near Williams and the Grand
Canyon, respectively, the average maximum temperature is 64 °F, with July being the
warmest month (mean = 84
°F); highs can approach 95
°F. Winter daily low temperatures
average 35
°F at Williams and 32
°F at the Grand Canyon, with January being the coolest
month (mean = 19
°F); winter lows at the Grand Canyon often dip below 0
°F.
Precipitation varies considerably along the length of the study area, with Williams
averaging 21.6 inches annually, including an average snowfall accumulation of
69.3 inches. Precipitation drops off to the north along SR 64 at Valle, where it averages
only 9.4 inches annually, with 4.8 inches of annual snow accumulation. Precipitation at
Tusayan (Grand Canyon Airport) is greater than at Valle but is still less than the south
portion of SR 64; annual precipitation averages 13.7 inches, with annual snowfall of
44.3 inches. Precipitation occurs primarily during intense and localized thunderstorms
associated with the summer monsoon and more widespread frontal storms that pass
through the state in the winter.

18
Figure 2. Great Basin Conifer Woodland Adjacent to SR 64 (Top) with Open to Dense
Stands of Pinyon and Juniper and Cliffrose, Apache Plume, and Other Shrubs, and Plains
and Great Basin Grasslands (Bottom) Dominated by Blue and Black Grama, Galleta, and
Needle-and-Thread Grasses.
19
3.1.2 Vegetation
Vegetation is diverse and exhibits characteristics of the Petran Montane Conifer Forest,
the Great Basin Conifer Woodland, and the Plains and Great Basin Grassland biotic
communities (Brown 1994). Ponderosa pine dominates montane coniferous forests at the
southernmost and northernmost portions of the study areas. Gambel oak occurs in the
overstory. Big sagebrush, rabbitbrush, and cliffrose dominate the understory. Sagebrush
is particularly prevalent at the drier north extent of the study area.
The ponderosa pine–dominated forest adjacent to SR 64 is interspersed with small
openings in draws and flats vegetated by sagebrush, blue grama, and other grasses.
Though these sites are dry, they nonetheless may correspond to WVC incidence hotspots
as observed for wet meadow habitats adjacent to SR 260 by Dodd et al. (“Evaluation of
Measures,” 2007) and Manzo (2006). Sparse to dense pinyon and one-seed juniper
dominate the overstory of extensive Great Basin conifer woodlands, with sagebrush,
cliffrose, Apache plume, and other shrubs in the understory, along with blue grama and
other grasses in openings (Figure 2). Conifer woodlands transition to Plains and Great
Basin grasslands dominated by blue and black grama, galleta, and needle-and-thread
grasses, with winterfat and sage interspersed with sparse junipers (Figure 2).
3.1.3 Wildlife Species
The focal species of this study were elk, mule deer, and pronghorn. SR 64 separates
Game Management Units (GMUs) 7 and 10 south of Valle and bisects GMU 9 between
Valle and Tusayan. Elk are found in moderate densities at the south end of the study area
and at high densities at the north end of the study area, with low densities in between
(Figure 3). During the project (2007 through 2009), the AGFD surveyed an average of
424 elk in GMU 9, with a robust ratio of bulls in relation to cows and calves (39 bulls :
100 cows : 32 calves). In GMU 7, an average of 355 elk were surveyed annually
(22 bulls: 100 cows : 39 calves).
At the north extent of the study area, mule deer are commonly seen along the highway
corridor and occur in high densities; they occur in moderate densities at the south extent
and in low densities in between (Figure 3). During the study, an average of 303 mule deer
were surveyed by the AGFD each year (17 bucks : 100 does : 42 fawns). In GMU 7,
extending far east of SR 64, 151 deer were classified in surveys each year (25 bucks : 100
does : 37 fawns).
The pronghorn population levels in grassland and open woodland areas of GMUs 9 and 7
are considered average relative to other northern Arizona populations. However, pockets
of habitat east of SR 64 in GMUs 7 and 9 hold high densities of pronghorn (Figure 3),
and the population on the east side is larger than the population on the west. In GMU 9,
an average of 119 animals were surveyed each year during this project (47 bucks : 100
does : 26 fawns). For GMU 7, an average of 247 pronghorn were surveyed each year
(31 bucks : 100 does : 25 fawns).

20
Figure 3. Density Distributions for the Three Target Species of Research along SR 64:
Elk (Left), Mule Deer (Center), and Pronghorn (Right).

21
3.1.4 Cataract Canyon Bridge
Reflective of the generally rolling terrain along the highway corridor, Cataract Canyon
Bridge at MP 187.3 near Kaibab Lake is one of the most substantial bridge structures
along the 57 mi study area (Figure 4). This 44 ft wide reinforced concrete box-culvert
bridge was constructed in 2001, with four 26 ft spans, for a total length of 104 ft. The
bridge cells have a 16 ft vertical clearance. Due to the moderate to high elk numbers and
moderate mule deer density in the vicinity of this bridge, there was an opportunity to
evaluate existing wildlife use to document and better understand the efficacy of this
structure type to serve as an effective wildlife crossing structures without fencing.
Dodd et al. (“Evaluation of Measures,” 2007) stressed the need for ungulate-proof funnel
fencing to guide animals toward passage structures to achieve desired wildlife use.
Without fencing, animals continue to cross the highway at grade. Though ADOT was
amenable to such fencing near Cataract Canyon Bridge and conducted a formal analysis,
there were too many concerns to move forward with fencing to coincide with this
research project. One of the foremost concerns related to addressing potential “end run”
or forcing of elk to another location along SR 64 at the termini of the fencing, including
immediately adjacent to I-40. As such, no fencing was erected in association with this
bridge during the project.
Figure 4. Cataract Canyon Bridge on SR 64.
22
3.2 TRAFFIC VOLUME
Average annual daily traffic (AADT) volume on SR 64 was measured at 4343 vehicles
per day in 2008 and 4208 vehicles per day in 2009, or an average of 4275 vehicles per
day. Since late 2007, traffic volume has been continuously measured by a permanent
automatic traffic recorder (ATR) installed near Valle. Traffic volumes were highest
during daytime hours (Figure 5).
Compared with other study areas in central and northern Arizona, including SR 260
(Dodd et al. “Effectiveness of Wildlife,” in review), US 89 (Dodd et al. 2011), and
Interstate 17 (Gagnon et al. “Elk Movements Associated,” in review), SR 64 is unique in
that traffic is virtually nonexistent during the late nighttime hours, averaging less than
10 vehicles per hr for a 4 hr period (Figure 5). This reflects the predominant tourist
destination nature of motorists traveling SR 64 to and from GCNP and not using this
route for regional or interstate travel beyond GCNP at night. This is also reflected in the
relatively small proportion of commercial vehicles traveling SR 64—only 0.07 percent
during the day and 0.05 percent at night—compared with SR 260, where commercial
traffic exceeded 40 percent at night (Dodd et al. “Effectiveness of Wildlife,” in review),
and US 89, where commercial vehicles made up a third of the nighttime traffic (Dodd et
al. 2011).
Peak annual traffic volume along SR 64 between 10:00 and 17:00 averaged 355 vehicles
per hr, equivalent to an AADT volume of 8800 vehicles per day, though in summer it was
considerably higher. Mean monthly traffic volume was highest during summer (June–
August; 5710 AADT), when it was three times higher than volume during the lowest
traffic months of December–February (1775 AADT). Traffic volume was highest on
Saturdays—nearly 20 percent higher than during the rest of the week.

23
Figure 5. Hourly Traffic Volume (Vehicles per Hour) along SR 64, Arizona, from 2007
through 2009. Note the Low Volume of Traffic during Nighttime Hours (00:00–04:00).
24
25
4.0 METHODS
4.1 WILDLIFE CAPTURE, GPS TELEMETRY, AND DATA ANALYSIS
4.1.1 Elk Capture
The research team captured elk at 14 sites adjacent to SR 64, along Highway Sections A
and E, at the north and south extremes of the study area; 11 sites were concentrated
adjacent to Section E. Elk were trapped primarily in net-covered Clover traps (Clover
1954) baited with salt and alfalfa hay; all traps were within 0.5 mi of the highway
corridor and near permanent water sources (Figure 6).
Elk were also captured by nighttime darting from a vehicle along the highway aided with
a spotlight. The low volume of traffic late at night made such capture possible. Trapped
animals were physically restrained, and all animals were blindfolded, ear-tagged, and
fitted with global positioning system (GPS) receiver collars (Figure 6). Darted elk were
administered a reversal drug when handling was complete. Elk were instrumented with
Telonics, Inc., Model TGW-3600 store-on-board GPS collars programmed to receive a
GPS relocation fix every two hours. All collars had very high frequency (VHF) beacons,
mortality sensors, and programmed release mechanisms to allow recovery. Battery life
for the GPS units was approximately two years.
4.1.2 Mule Deer Capture
The research team attempted to trap mule deer in small Clover traps baited with sweet
feed and salt at five sites adjacent to Section E but had no success. Therefore, the team
shifted to nighttime darting from a vehicle along or immediately adjacent to SR 64, aided
by a spotlight. Again, the low volume of traffic late at night made such capture feasible.
Deer were blindfolded, ear-tagged, and fitted with GPS receiver collars (Figure 6), and
then administered a reversal drug. Most deer were fitted with Telonics, Inc. Model TGW-
3500 GPS receiver collars (Figure 6) programmed to receive a fix every two hours, with a
battery life of 11 months. Four deer were fitted with Telonics Generation IV GPS
receiver collars that had a one-year battery life. All collars had VHF mortality sensors
and programmed release mechanisms for recovery.
4.1.3 Pronghorn Capture
The research team captured pronghorn using a net gun fired from a helicopter (Firchow et
al. 1986, Ockenfels et al. 1994, Dodd et al. 2011; Figure 6). A fixed-wing aircraft and
numerous ground spotters using optics equipment were employed to search for pronghorn
during capture to minimize helicopter searching. Pronghorn were captured during winter
to minimize heat-related stress on animals as well as deleterious effects on females that
could occur if captured later in their pregnancies.

26
Figure 6. Photographs of Capture Techniques Used for Elk, Mule Deer and Pronghorn
along SR 64 and GPS-Collared Animals: Elk Captured with Net-Covered Clover Trap
(Top), Darting to Immobilize Mule Deer (Middle), and Net-Gunning of Pronghorn from a
Helicopter (Bottom).
27
The team’s capture objectives were to:
Instrument as nearly an equal number of pronghorn on each side of SR 64 as possible
because the research team suspected that SR 64 would be a barrier similar to US 89
(Dodd et al. 2011).
Spread the collars among as many different herds as possible along the length of the
study area.
Capture animals within 2 mi of SR 64.
Upon capture, pronghorn were immediately blindfolded and untangled from the capture
net. Animals were fitted with a GPS collar and marked with a numbered, colored ear tag
(Figure 6). Tissue samples were taken from animals’ ears with a paper punch and
preserved for future genetic analysis. The research team instrumented pronghorn with
Telonics, Inc. Model TGW-3500 store-on-board GPS receiver collars programmed to
receive 12 GPS fixes per day, with one fix every 90 minutes between 04:00 and 22:00.
GPS units had a battery life of 11 months. All collars had VHF beacons, mortality
sensors, and programmed release mechanisms to allow recovery.
4.1.4 GPS Analysis of Animal Movements
Once GPS collars were recovered and data downloaded, the research team employed
ArcGIS
®
Version 8.3 Geographic Information System software (ESRI
®
, Redlands,
California) to analyze GPS data similar to analyses done for elk by Dodd et al.
(“Assessment of elk,” 2007), white-tailed deer (Dodd and Gagnon 2011), and pronghorn
(Dodd et al. 2011). The team calculated individual minimum convex polygon (MCP;
connecting the outermost fixes) home ranges composed of all GPS fixes (White and
Garrott 1990). Differences in means were assessed by analysis of variance, and means
were reported with ±1 standard error (SE).
Crossings were compared among the following seasons:
Late spring–summer (April–July).
Late summer–fall (August–November).
Winter–early spring (December–March).
4.1.5 Calculation of Crossing and Passage Rates
The team divided the entire length of SR 64 from I-40 to the Grand Canyon village into
570 sequentially numbered 0.1 mi segments corresponding to the units used by ADOT
for tracking WVCs and highway maintenance, and identical to the approach used by
Dodd et al. (“Evaluation of Measures,” 2007, Figure 1). The number and proportion of
GPS fixes within 0.15, 0.30, and 0.60 mi of SR 64 were calculated for each animal.
28
To determine highway crossings, the team drew lines connecting all consecutive GPS
fixes. Highway crossings were inferred where lines between fixes crossed the highway
through a given segment (Dodd et al. “Evaluation of Measures,” 2007, Figure 7). Animal
Movement ArcView Extension Version 1.1 software (Hooge and Eichenlaub 1997) was
used to assist in animal crossing determination. The research team compiled crossings by
individual animal by highway segment, date and time, and calculated crossing rates for
individual elk, mule deer, and pronghorn by dividing the number of crossings by the days
a collar was worn.
The research team calculated passage rates for collared animals, which served as its
relative measure of highway permeability (Dodd et al., “Evaluation of Measures,” 2007).
An approach was considered to have occurred when an animal traveled from a point
outside the 0.15 mi buffer zone to a point within 0.15 mi of SR 64, determined by
successive GPS fixes (Figure 7). The approach zone corresponded to the road-effect zone
associated with traffic-related disturbance (Rost and Bailey 1979, Forman et al. 2003)
previously used for elk and white-tailed deer by Dodd et al. (“Evaluation of Measures,”
2007, Dodd and Gagnon 2011). Animals that directly crossed SR 64 from a point beyond
0.15 mi were counted as an approach and a crossing.
The research team calculated passage rates as the ratio of recorded highway crossings to
approaches. The research team tested the hypothesis that the observed spatial crossing
distribution among 0.10 mi segments did not differ from a discrete randomly generated
distribution using a Kolmogorov-Smirnov test (Clevenger et al. 2001; Dodd et al.,
“Assessment of elk,” 2007), a test that is sensitive to the difference in ranks and shape of
the distributions. The team used linear regression to assess the strength of associations
between passage rates and traffic volume, as well as between the frequency of highway
crossings and WVCs at the MP (1.0 mi) scale using WVC records from 1991 through
2009 on those highway stretches with elk or deer crossings.

29
Figure 7. GPS Locations and Lines between Successive Fixes to Determine Highway
Approaches and Crossings in 0.10 mi Segments. The Expanded Section Shows GPS
Locations and Lines between Successive Fixes to Determine Approaches to the Highway
(Shaded Band) and Crossings. Example A Denotes an Approach and Crossing; Example
B Denotes an Approach without a Crossing.
4.1.6 Calculation of Pronghorn Approaches
Based on previous northern Arizona pronghorn highway telemetry research (Ockenfels et
al. 1997, van Riper and Ockenfels 1998, Bright and van Riper 2000, Dodd et al. 2011),
the research team anticipated few pronghorn crossings or approaches to within 0.15 mi
associated with crossings. As such, the team used the number of approaches by
pronghorn to within 0.30 mi to determine the distribution of animals adjacent to SR 64
for the purposes of assessing the need for, and potential location(s) of, passage structures,
as was done for the US 89 study (Dodd et al. 2011). Use of this greater approach distance
also was deemed appropriate given the relatively open nature of pronghorn habitat,
pronghorn reliance on visual stimuli in risk avoidance (Gavin and Komers 2006), and
pronghorn mobility over long distances (Yoakum and O’Gara 2000) compared with other
ungulates.
Pronghorn highway approaches were determined for animals approaching from each side
of SR 64 and both sides combined. The research team tested the hypothesis that the
A
B

30
observed spatial approach distribution among 0.10 mi segments did not differ from a
discrete randomly generated approach distribution using a Kolmogorov-Smirnov test
(Dodd et al. 2011).
4.1.7 Calculation of Weighted Crossings and Approaches
To account for the number of individual elk, deer, and pronghorn that crossed (and
approached, in the case of pronghorn) each highway segment adjacent to SR 64, as well
as evenness in crossing frequency among animals, the research team calculated Shannon
diversity indexes (SDIs; Shannon and Weaver 1949) for each segment using this formula:
Thus, to calculate SDI (or H ) for each highway segment, the researchers calculated and
summed all the -(p
i
ln p
i
) for each animal that had approaches in the segment, where each
p
i
is defined as the number of individual collared elk and deer crossings and approaches
for pronghorn within each segment divided by the total number of respective crossings or
approaches in the segment. SDI were used to calculate weighted crossing or approach
frequency estimates for each segment, multiplying uncorrected crossings or approach
frequency by SDI. Weighted highway crossings and approaches better reflected the
number of crossing and approaching animals and the equity in distribution among elk,
deer, and approaching pronghorn (Dodd et al., “Evaluation of Measures,” 2007).
4.2 TRAFFIC VOLUME AND ANIMAL DISTRIBUTION RELATIONSHIPS
The research team measured traffic volume using a permanent automatic traffic recorder
(ATR) programmed to record hourly traffic volumes. ADOT’s Data Team provided data
collected from the ATR immediately north of Valle.
The research team examined how the proportion of elk, deer, and pronghorn GPS
relocations at different distances from the highway varied with traffic volume by
calculating the proportion of fixes in each 330 ft distance band, out to a maximum of
3300 ft. As done for elk (Gagnon et al. “Effects of traffic,” 2007), white-tailed deer
(Dodd and Gagnon 2011), and pronghorn (Dodd et al. 2011), the research team combined
traffic and GPS data by assigning traffic volumes for the previous hour to each GPS
location using ArcGIS
Version 9.1 and Microsoft
®
Excel
®
software.
1
This allowed the
team to correlate the traffic volume each animal experienced in the hour prior to
movement to a particular point, regardless of distance traveled.
To avoid bias due to differences in the number of fixes for individual animals, the
proportion of fixes occurring in each distance band for each animal was used as the
sample unit, rather than total fixes. The research team calculated a mean proportion of
animals and fixes for all animals within each 330 ft distance band at varying traffic
1
Microsoft and Excel are either registered trademarks or trademarks of Microsoft Corporation in the
United States and/or other countries.
31
volumes: less than 100, 101–200, 201–300, 301–400, 401–500, and 501–600 vehicles per
hr (Gagnon et al. “Effects of traffic,” 2007).
The team compared elk, mule deer, and pronghorn distribution and highway impact along
SR 64, and compared the species-specific distributions to those for elk (Gagnon et al.
“Effects of traffic,” 2007) and white-tailed deer on SR 260 (Dodd and Gagnon 2011) and
pronghorn on US 89 (Dodd et al. 2011). The team also assessed and compared species-
specific highway passage rates by time of day and associated traffic volume and used
linear regression to assess the strength of associations between WVCs and traffic volume.
4.3 WILDLIFE-VEHICLE COLLISION RELATIONSHIPS
The research team documented the incidence of WVCs along all SR 64 sections using
two methods. First, the research team relied on the submission of forms by agency
personnel, primarily DPS highway patrol officers, to determine the incidence of WVCs
during the study. DPS patrol officers made a concerted effort to record the species and
sex of animals involved in WVCs where such could be determined. These records were
augmented by regular searches of the highway corridor for evidence of WVCs by
research personnel.
The database compiled from the consolidated (non-duplicate) records included the date,
time, and location (to the nearest 0.1 mi) of the WVCs, the species involved, and the
reporting agency. WVC records were compiled and summarized by highway section by
year. Where duplicate reports of WVCs were made by DPS and research team searches,
the locations were compared to determine their accuracy (Barnum 2003, Gunson and
Clevenger 2003).
The research team used a database compiled by the ADOT Traffic Records Section
which includes DPS accident reports to determine the proportion of single-motor vehicle
accidents that involved wildlife along the respective highway sections. Huijser et al.
(2007) reported that nearly all WVCs are single-vehicle crashes. The research team
compared WVC incidence by season (using the same seasons for highway crossings),
month, day, and time (2 hr intervals), and used chi-square tests to compare observed
versus expected WVC frequencies.
4.4 WILDLIFE USE OF CATARACT CANYON BRIDGE
To quantify wildlife use of Cataract Canyon Bridge, the research team employed
Reconyx
™
professional model single-frame cameras installed within each of the four
box-culvert cells (Figure 8). The encased cameras were mounted on wood strips attached
to the culvert walls with glue, thus avoiding the need to make modifications to the walls
that might impact their integrity. These self-triggering cameras provided infrared
illumination to record animals crossing through the bridge at night. The cameras were
programmed to record up to five frames per second, providing near-video-like tracking of
animals as they approached and crossed through the bridge cells. Images were date, time,
and temperature stamped (Figure 9), digitally stored, and periodically downloaded for
analysis.

32
Figure 8. Reconyx
™
Camera Mounted on a Wood Strip Glued to the
Concrete Surface of Each SR 64 Cataract Canyon Bridge Culvert Cell to Monitor
Wildlife Use.
Figure 9. Images of a Mule Deer Doe (Left) and Spike Bull Elk (Right)
Recorded by Reconyx
™
Cameras Mounted
in the SR 64 Cataract Canyon Bridge Culvert Cells.
The research team analyzed camera data to determine the frequency of occurrence of
animals by species (and people) that entered and then passed through the bridge cells.
Though not able to determine underpass passage rates as done by Dodd et al. (“Video
surveillance to assess,” 2007) using video camera systems, the proportion of animals that
entered the culvert cells and ultimately passed through provided some indication of the
relative acceptance by animals to cross SR 64 below grade via Cataract Canyon Bridge.
33
4.5 IDENTIFICATION OF PASSAGE STRUCTURE SITES
Sawyer and Rudd (2005) identified several important considerations for locating the most
suitable sites in which to place passage structures, primarily for pronghorn, though these
criteria are applicable for other species. In this assessment of potential passage structure
sites and to validate the preliminary findings in ADOT (2006), the research team
considered each of the criteria identified by Sawyer and Rudd (2005) but recognized that
the 0.1 mile segment length used was too small and cumbersome to discern and analyze
differences among segments.
Dodd et al. (“Evaluation of Measures,” 2007) reported that the optimum scale to address
management recommendations for accommodating wildlife passage needs using GPS
telemetry or WVC data was at the 0.6 mi scale. Making recommendations at this scale
allows ADOT engineers latitude to determine the best technical location for passage
structures along the segment. Thus, the team aggregated the 570 0.1 mi segments from
MP 185.5 to MP 235.4 into 95 0.6 mi segments for analysis. The research team addressed
passage structure needs for the entire highway study area as well as each individual
highway section.
Sawyer and Rudd (2005) identified animal abundance as a primary criterion for the
consideration of passage structure sites. The research team focused this criterion on the
larger population levels adjacent to the entire study area versus by segment. For
pronghorn, Sawyer and Rudd (2005) stressed that passage structures were more
appropriate in linking populations with “abundant numbers (hundreds)” than small
isolated populations that may not benefit to the same degree and exhibit a high likelihood
of encountering passage structures. The pronghorn, elk, and mule deer populations
adjacent to SR 64 indeed number well into the hundreds, with the herds for all three on
both sides of the highway still viable and reproducing.
The team used the other segment-specific criteria identified by Sawyer and Rudd (2005)
with some modifications to rate each of the 95 0.6 mi segments, considering GPS
telemetry findings with other pertinent factors, as done for US 89 by Dodd et al. (2011).
Because passage structures that have the potential to benefit permeability for multiple
species are preferred (Clevenger and Waltho 2000), some ratings for elk, deer, and
pronghorn were additive, thus weighting those sites that may yield benefit to multiple
species. However, because pronghorn range largely did not overlap the higher-density
portions of elk and mule deer ranges (Figure 3) and because few, if any, WVCs involving
pronghorn were anticipated, the team made separate passage structure recommendations
for this species.
34
The team’s rating criteria/categories were as follows:
Elk highway crossings – Due to the anticipated availability of highway crossing
data for elk, this rating was based on the proportion of SR 64 crossings made by
GPS-collared elk within each aggregated 0.6 mi segment across the entire study
area. The ratings for elk crossings were additive to mule deer crossings and
pronghorn approaches. Categories used include:
0 No crossings
1 1–2% of total elk crossings
2 3–4% of total elk crossings
3 5–6 % of total elk crossings
4 7–8% total elk crossings
5 >8% of total elk crossings
Mule deer highway crossings – This rating was also based on the proportion of
SR 64 crossings made by GPS-collared mule deer within each aggregated 0.6 mi
segment. However, because deer were only captured adjacent to SR 64 Section E,
rather than adjacent to a greater length of SR 64, the ratings reflect higher
proportions of crossings. The ratings for mule deer crossings were additive to
those for elk crossings and pronghorn approaches. Categories used include:
0 No crossings
1 1–2% of total crossings for the species
2 3–4% of crossings for the species
3 5–6 % of crossings for the species
4 7–8% of crossings for the species
5 >8% of total crossings for the species
Pronghorn approaches – This criterion was considered indicative of where
animals potentially would approach and cross SR 64 via a passage structure and
was based on the proportion of approaches to within 0.3 mi on both sides of the
highway for aggregated 0.6 mi segments. This rating was additive with elk and
mule deer crossing ratings where GPS-collared animals overlapped. Categories
used include:
0 No approaches
1 1–3% of total pronghorn approaches
2 3–5% of total pronghorn approaches
3 5–15% of total pronghorn approaches
4 15–25% of total pronghorn approaches
5 >25% of total pronghorn approaches
35
Elk, mule deer, and pronghorn distribution – This rating was based on the number
of different GPS-collared animals that crossed SR 64 for elk and deer and were
relocated within the 0.3 mi approach zone for pronghorn. This rating was additive
for each of the three species where data overlapped. Categories used include:
0 No animals crossing or approaching
1 1–2% of all animals crossing or approaching
2 2–4% of all animals crossing or approaching
3 4–6% of all animals crossing or approaching
4 6–8% of all animals crossing or approaching
5 >8% of all animals crossing or approaching
Wildlife-vehicle collisions – The number of non-duplicate WVCs recorded by
0.6 mi segment during the project (2007–2009) for elk, mule deer, pronghorn, and
other large mammals such as mountain lion, black bear, badger, etc. categories
used include:
0 No WVC
1 1–2 total WVCs
2 3–4 total WVCs
3 5–6 total WVCs
4 7–8 total WVCs
5 >8 total WVCs
Land status – This criterion reflected the ability to conduct construction activities
on and outside the ADOT right-of-way (ROW), such as creating approaches with
fill material for overpasses. Categories used include:
0 Private
1 State Trust
3 National Park Service – GCNP (preservation and natural process
focus)
5 Federal – U.S. Forest Service (multiple-use focus)
Human activity – Ideally, no human activity should occur within the vicinity of a
passage structure; however, road access, businesses, visitor pullouts, and other
activities occur adjacent to US 89. Categories used include:
0 Significant human activity (business, housing, etc.)
1 Moderate human activity (access road, visitor pullout)
3 Limited human activity
5 No human activity
36
Topography – The ability to situate overpasses oriented along existing ridgelines
that pronghorn, elk, or deer can traverse, or locate underpasses in association with
wide gentle drainages is desirable. Categories used include:
0 Terrain not suited for a passage structure (steep, broken)
1 Topography marginal for a passage structure (flat)
3 Topography could accommodate a passage structure (small
drainage)
5 Topography ideally suited for passage structure (large drainage for
underpass or ridgeline for overpass)
In addition to the above criteria, the research team also considered other factors in its
identification of potential passage structure sites. These factors included whether the
0.6 mile segments coincided with the preliminary sites recommended in ADOT (2006), if
the types of structures were suited for the site, and how the priority segments from this
study relate to the minimum recommended passage structure spacing determined by
Bissonette and Adair (2008).
37
5.0 RESULTS
5.1 WILDLIFE CAPTURE, GPS TELEMETRY, AND DATA ANALYSIS
5.1.1 Elk Capture, Movements, and Highway Permeability
From June 2007 through October 2009, the research team tracked and recovered data
from 23 elk (13 females, 10 males) instrumented with GPS receiver collars; 17 elk were
trapped in Clover traps and six were captured by darting with immobilizing drugs. Only
three elk were captured at the far south end of the study area adjacent to Section A, while
the remainder were captured at the north end adjacent to Section E (Figure 1).
GPS collars were affixed to elk for an average of 302.9 days (33.4 SE), during which
time the collars accrued 107,055
GPS fixes for a mean of 4654.6 fixes per elk (322.6).
Of the GPS fixes, 12,483 (11.6 percent) were recorded within 0.6 mi of SR 64, and 3796
(3.5 percent) of the fixes were made within 0.15 mi; the proportion of fixes near SR 64
were considerably lower than those for SR 260, where 48.5 percent occurred within
0.6 mi of the highway (Dodd et al. “Effectiveness of Wildlife,” in review). Elk traveled
an average of 1082.1 ft (105.3) between GPS fixes. Males traveled slightly farther
between crossings (1107.1 ft 57.5) than females (1051.2 ft 142.1). Elk minimum
convex polygon (MCP) home ranges averaged 284.8 mi
2
(56.3), and male home ranges
(479.5 mi
2
165.5) which were significantly larger (t
21
= 2.45, P < 0.001) than female
home ranges (199.6 mi
2
17.8).
GPS-collared elk crossed SR 64 843 times, for a mean of 40.1 crossings per elk (11.2).
On average, elk crossed SR 64 0.12 time per day (0.03), and ranged from 1 to
200 crossings per elk, though four elk never crossed SR 64. The highest proportion of
crossings occurred in late spring–summer (April–July; 60 percent), followed by late
summer–fall (August–November; 27 percent), and only 13 percent during winter–early
spring (December–March). The overall elk passage rate averaged 0.44 crossing per
approach (0.07; Table 3). There was no significant statistical difference between mean
passage rates for female and males elk (0.46 0.08 vs. 0.43 0.12 respectively).
The crossing distribution by elk among SR 64 0.1 mi segments was not random and
exhibited several peak crossing zones (Figure 10), especially at the north end of the study
area. The observed crossing distribution differed significantly from a random distribution
(Kolmogorov-Smirnov d = 0.309, P < 0.001). The limited number of crossings at the
southern area (Section A) reflects that only three elk were captured in this area and that
these elk crossed SR 64 only an average of three times versus the study area average of
40.1 crossings per elk.
A total of 48 crossings occurred along Section D, with one apparent peak crossing zone,
and 786 occurred along Section E, where several crossing peaks were registered by elk
(Figure 10). The highest concentration of different crossing elk occurred between
Segments 470 and 500, with seven animals (30.4 percent of all elk) and a mean of 3.2
different animals per 0.1 mi segment.

38
Weighted highway crossings reflect the frequency of elk crossings, the number of
individual elk that crossed at each segment, and the evenness in crossing frequency
among all collared animals. The weighted elk crossing pattern (Figure 11) was noticeably
different than the uncorrected crossing distribution. Crossing peaks on Sections A and D
were absent in the weighted crossing distribution due to the relatively small number of
elk that crossed at these peak zones (Figure 10).
Table 3. Comparative Mean Values for GPS-Collared Animals by Species Determined
from GPS Telemetry along SR 64.
Parameter
Mean value per GPS-collared animal by species (±SE)
Elk (n = 23) Mule deer (n = 11) Pronghorn (n = 15)
No. of highway crossings
40.1
(11.2)
55.0
(16.4)
0.2
(0.2)
Highway crossings per day
0.12
(0.03)
0.26
(0.06)
0.001
(0.001)
GPS fixes ≤0.6 mi of
highway
per year
632.2
(164.4)
1921.4
(637.7)
791.0
(184.4)
GPS fixes ≤0.15 mi of
highway per year
346.6
(97.7)
1054.9
(354.2)
370.1
(84.1)
GPS fixes ≤0.06 mi of
highway per year
198.8
(63.2)
522.4
(167.9)
116.7
(21.4)
Highway approaches per day
0.21
(0.04)
0.58
(0.12)
0.27
(0.16)
Passage rate
(crossings per approach)
0.44
(0.07)
0.54
(0.08)
0.004
(0.002)
MCP home ranges (mi
2
)
284.8
(56.3)
141.1
(48.3)
85.8
(21.1)
Distance traveled between
GPS fixes (ft)
1107.1
(57.5)
942.2
(232.9)
845.2
(46.6)

39
Figure 10. SR 64 Crossings by GPS-Collared Elk along the Entire Study Area (Top)
and Sections A through E of the 2006 Final Wildlife Accident Reduction Study and
Enlarged to Show Crossings along Sections D and E (Bottom).
Sections: A B C D E
Section D
Section E
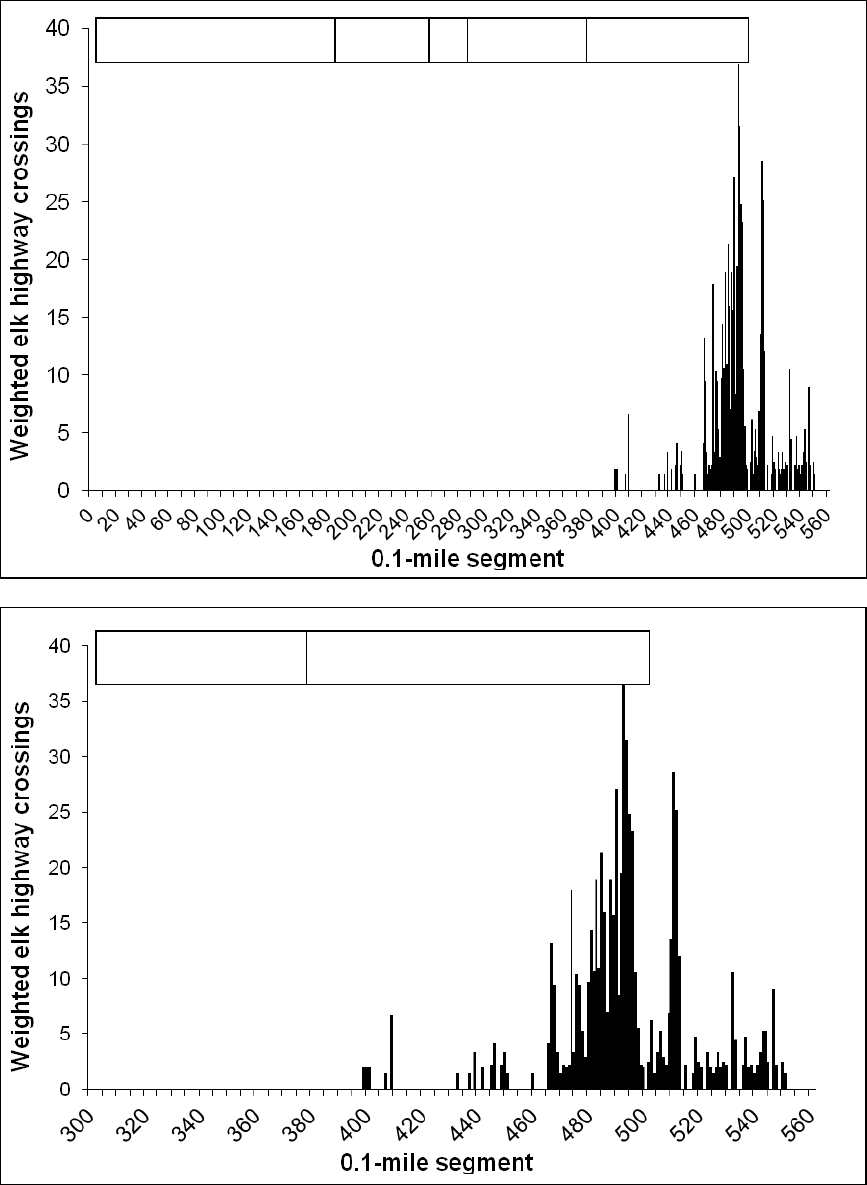
40
Figure 11. SR 64 Weighted Crossings by GPS-Collared Elk along the Entire Study
Area (Top) and Sections A through E of the 2006 Final Wildlife Accident Reduction
Study and Enlarged to Show Crossings along Sections D and E (Bottom).
Sections: A B C D E
Section D Section E
41
5.1.2 Mule Deer Capture, Movements, and Highway Permeability
From April 2008 through October 2009, the research team tracked and recovered data
from 11 mule deer (8 females, 3 males) instrumented with GPS receiver collars. Deer
were captured adjacent only to Section E at the far north extent of the study area.
GPS collars were affixed to deer for an average of 207.9 days (38.7), during which time
they accrued 29,944GPS fixes, for a mean of 5988.5 fixes per deer (128.0). Deer were
relocated near SR 64 more than elk, with 12,047 (57.2 percent) fixes recorded within
0.6 mi of SR 64, and 3796 (15.6 percent) of the fixes made within 0.15 mi of the
highway. Mule deer traveled an average of 942.2 ft (232.9) between GPS fixes. Males
traveled slightly farther between crossings (1003.7 ft 323.5) than females (820.9 ft
155.2). Home ranges averaged 141.1 mi
2
(48.3); male home ranges (189.8 mi
2
184.9)
were not significantly different (P = 0.343) from female ranges (132.3 mi
2
51.4).
Five mule deer (two males, three females) captured along SR 64 exhibited extreme long-
distance (more than 100 mi) movements away from SR 64 to the south, most
independently of each other. All five followed the same travel corridor to an area
northwest of Flagstaff and west of the San Francisco Peaks (Figure 12). The mean home
range of these five deer (342.1 mi
2
41.9) was 22 times greater than those that did not
make such movements (15.5 mi
2
3.6; t
11
= 10.0, P < 0.001). The factors contributing to
such movement patterns is being addressed in another study by the research team, but
such movements point to the need to maintain landscape connectivity for far-ranging
species.
Collared deer crossed SR 64 550 times, for a mean of 55.0 crossings per deer (16.4).
On average, deer crossed SR 64 twice as frequently as elk, or 0.26 times per day (0.06).
Deer crossings ranged from 2 to 147 crossings per deer, and one deer never crossed SR
64. Seasonal deer crossings were more consistent than elk, though 46 percent occurred
during late summer–fall (August–November), followed by 28 percent in late spring–
summer (April–July), and 26 percent in winter–early spring (December–March). The
overall deer passage rate was higher than that for elk and averaged 0.54 crossing per
approach (0.08; Table 3). The mean passage rate for female deer (0.59 crossing per
approach; 0.08) was higher than that for male deer (0.34 0.34).
The deer crossing distribution by 0.1 mi segments did not occur randomly and exhibited
two peak crossing zones; all crossings occurred along Section E beyond Segment 420
(Figure 13). The observed mule deer crossing distribution differed significantly from a
random distribution (Kolmogorov-Smirnov d = 0.281, P < 0.001). The two crossing
peaks occurred along a 3.2 mi stretch (Segments 480–512) between the entrances to
Grand Canyon Airport and GCNP (Figure 13); 505 crossings (92 percent of total)
occurred along this stretch of highway, though deer were captured along the length of
Section E.

42
Figure 12. Mule Deer GPS Fixes along the SR 64 Study Area, as well as Fixes for Two
Deer Captured North of Flagstaff (Numbers 43 and 172).
When considering the number of crossing mule deer in calculating weighted crossings,
the same two peaks in the crossing distribution were even more apparent. Deer crossings
between Segments 450 and 470 largely disappeared and were restricted to two segments
when weighted crossings were calculated (Figure 13).
5.1.3 Pronghorn Capture, Movements, and Highway Approaches
The research team instrumented and tracked 15 pronghorn (10 females, 5 males) with
GPS receiver collars from January 2008 through January 2009. Due to disparity in the
distribution of pronghorn herds (Figure 3) adjacent to SR 64, coupled with the prevalence
of closed private lands across much of the pronghorn range, the team was not able to
achieve its objective of collaring an equal number of animals on each side of the
highway; 10 were captured on the east side and five on the west.
GPS collars were affixed to pronghorn an average of 298.1 days (29.6), during which
time the collars accrued 56,433 GPS fixes for a mean of 3762.2 fixes per pronghorn
(339.0).

43
Figure 13. SR 64 Highway Crossings (Top) and Weighted Crossings (Bottom) by GPS-
Collared Mule Deer along Highway Section E by 0.1 mi Segment.
44
Of the GPS fixes accrued for pronghorn, 1426 (3 percent) occurred within 0.15 mi of SR
64, or an average of 95.1 (26.1) fixes per animal; all but one pronghorn approached the
highway to within 0.15 mi. All 15 pronghorn approached to within 0.60 mi of the
highway, accruing 9729 GPS fixes (17 percent of all fixes), with a mean of 648.6
(151.2) fixes per animal. During the duration of GPS tracking, pronghorn traveled an
average of 845.2 ft (46.6) between fixes (1.5 hr). Females traveled farther between fixes
(905.5 ft 44.6) than males (724.1 ft 72.2). Pronghorn home ranges averaged 85.8 mi
2
(21.1), and there was no difference between male (88.6 mi
2
29.6) and female (84.4 mi
2
34.5) home ranges (P = 0.469).
Only a single GPS-collared pronghorn crossed SR 64 during tracking—a female that
crossed three times; none of the other 14 collared pronghorn crossed the highway. The
pronghorn crossing rate averaged 0.001 crossings per day. The mean pronghorn passage
rate was a negligible 0.004 crossings per approach (Table 3).
The frequency of approaches by pronghorn to within 0.30 miles of SR 64 yielded
considerably more information than crossings for the determination of potential passage
structure locations. Pronghorn approached the highway to within 0.30 miles 4269 times
(Figure 14), for a mean of 284.6 (±69.0) approaches per animal and a range of 2 to 907
approaches.
The observed approach distribution did not occur in a random distribution (Kolmogorov-
Smirnov d = 0.883, P < 0.001). Partly owing to the disparity in the number of collared
animals on the east and west sides of SR 64, it is not unexpected that 3623 approaches
were from the east and only 465 from the west. However, the approaches per animal were
also dramatically different; 362.2 approaches per animal (±74.4) on the east side versus
91.2 approaches per animal (±121.3) from the west. All but two approaches to SR 64
between Segments 1 and 220 were made by pronghorn approaching from the east, though
a limited number of animals were captured on the west side along this stretch.
Shannon diversity index (SDI)-weighted pronghorn approaches totaled 2756.7, and the
distribution pattern changed considerably from the uncorrected approach distribution.
The peak in crossings at the south end of the study area disappeared, owing to there being
only a single male that approached here. The weighted distribution of approaches also
showed an increased peak in approaches at the north extent of pronghorn range, between
Segments 310 and 390. Between Segments 340 and 370, 11 different collared animals
(73.3 percent of total) approached SR 64, with a mean of 6.9 different animals per 0.1
mile segment. The peak in approaches between Segments 180 and 220 at the center of the
study area remained prevalent even after SDI-weighted approaches were calculated
(Figure 14), though approaches here were attributable to just two pronghorn.

45
Figure 14. Highway Approaches (Top) and Weighted Approaches (Bottom) Made to
within 0.3 mi of SR 64 by GPS-Collared Pronghorn and Sections A through E of the
2006 Final Wildlife Accident Reduction Study.
Sections: A B C D E
Sections: A B C D E
46
5.2 TRAFFIC RELATIONSHIPS
5.2.1 Elk-Traffic Relationships
The research team’s elk distribution analysis was based on 12,483 GPS fixes recorded
within 3300 ft of the highway. Frequency distributions of mean probabilities showed a
shift in distribution away from SR 64 with increasing traffic volume (Table 4; Figure 15).
The shift away from the highway occurred even at relatively low traffic volume
(Figure 15), with a 64 percent decrease in probability of elk occurring within 660 ft from
traffic volume less than 100 vehicles per hr (0.28 probability) to 200 to 300 vehicles per
hr (0.10). The mean probability of elk occurring within 660 ft of SR 64 remained
constant at 0.08 from 200 to 600 vehicles per hr. The mean probability of elk occurring
farther away from the highway (1650 and 1980 ft distance bands) increased 65 percent
from traffic less than 100 vehicles per hr (0.17) to 500 to 600 vehicles per hr (0.28).
Elk passage rates by 2 hr time blocks ranged from 0.01 (18:00–20:00) to 0.72 crossings
per approach (04:00–06:00), with the passage rate between midnight and 04:00 when
traffic was nearly absent along the highway (Figure 5) averaging 0.63 crossings per
approach (0.05; n = 45). This nighttime rate was more than three times higher than the
mean passage rate during the rest of the day, averaging 0.19 crossings per approach
(0.04; n = 72; Figure 16). There was a significant negative association between the elk
passage rate by 2 hour blocks and increasing traffic volume (r = -0.660, P = 0.022). The
passage rate by day averaged 0.48 crossings per approach (±0.16) and was relatively
constant for most days (0.42–0.49) except for Tuesday (0.64).
5.2.2. Mule Deer–Traffic Relationships
The research team’s mule deer distribution analysis was based on 12,047 GPS fixes
recorded within 3300 ft of the highway. Mule deer frequency distributions of combined
mean probabilities showed shifts in distribution away from the highway with increasing
traffic volume, though not as dramatic as for elk (Table 4; Figure 17). At low traffic
volumes less than 200 vehicles per hr, probabilities for deer occurring within 660 ft of the
highway averaged 0.21 but dropped when traffic was more than 200 vehicles per hr and
remained static out to 1980 ft, averaging 0.11.
Mean deer probabilities of occurring within the 1650–1980 ft distance band largely
remained unchanged across traffic volume classes (mean = 0.21) up to 500 vehicles per
hr but dropped to a mean probability of 0.14 at more than 500 vehicles per hr. The most
dramatic shift in deer distribution occurred in the intermediate distance bands, 990–1320
ft from SR 64, with the probability of deer occurring here doubling from 0.12 at less than
100 vehicles per hr to 0.24 at just 100 to 200 vehicles per hr; the probability of deer
occurring at this distance remained static up to 500 vehicles per hr and averaged 0.21.
Deer passage rates by 2 hour time blocks ranged from 0.03 (19:00–21:00) to 0.78
crossings per approach (03:00–05:00 a.m.), with the passage rate between midnight and
04:00 a.m. when traffic was absent, averaging 0.58 crossings per approach (0.03). This
nighttime rate was more than two times the mean passage rate during the rest of the day,

47
averaging 0.28 crossings per approach (0.02; Figure 16). Unlike elk, the deer passage
rate remained relatively high (0.61 crossings per approach [0.02]) well into the morning
hours up until the 09:00–11:00 time block (Figure 16).
Due to the passage rates remaining high into the morning hours, the negative association
between the deer passage rate by 2 hr blocks and increasing traffic volume was not
significant (r = -0.07, P = 0.831). The passage rate by day of the week averaged 0.47
crossings per approach (±0.10), which was relatively constant for most days, and ranged
from 0.42 on weekend days to 0.50 the remainder of the week.
Table 4. Mean Probabilities that GPS-Collared Elk, Mule Deer,
and Pronghorn Occurred within Distance Bands from SR 64 at Varying Traffic Volumes.
Documented from 2007 through 2009.
Distance
from
highway (ft)
by species
Probability of occurring in distance band by traffic volume
(vehicles per hour)
<100 100–200 200–300 300–400 400–500 500–600
0–990
Elk
Mule deer
Pronghorn
All
0.36
0.38
0.23
0.34
0.21
0.32
0.18
0.22
0.18
0.23
0.16
0.19
0.18
0.17
0.15
0.17
0.15
0.18
0.12
0.14
0.15
0.19
0.11
0.14
990–1980
Elk
Mule deer
Pronghorn
All
0.26
0.27
0.30
0.28
0.26
0.34
0.33
0.30
0.28
0.33
0.32
0.30
0.31
0.31
0.34
0.32
0.31
0.31
0.31
0.31
0.40
0.21
0.35
0.33
1980–2970
Elk
Mule deer
Pronghorn
All
0.28
0.29
0.37
0.30
0.38
0.26
0.38
0.36
0.27
0.34
0.43
0.40
0.38
0.39
0.38
0.38
0.43
0.37
0.47
0.43
0.33
0.43
0.45
0.40

48
Figure 15. Mean Probability That GPS-Collared Elk Occurred within 330 ft Distance
Bands along SR 64 at Varying Traffic Volumes.
0
0.1
0.2
330 660 990 132016501980
Mean probability
Distance from highway (ft)
500-600 vehicles/hr

49
Figure 16. Mean SR 64 Passage Rates by Two-Hour Time Blocks (Reflected by the
Midpoint of the Blocks) and Corresponding Mean Traffic Volumes during Each Time
Block for Elk (Bottom) and Mule Deer (Top).

50
Figure 17. Mean Probability That GPS-Collared Mule Deer Occurred within 330 ft
Distance Bands along SR 64 at Varying Traffic Volumes.

51
5.2.3. Pronghorn-Traffic Relationships
The team’s distribution analysis was based on 9729 pronghorn GPS fixes recorded within
3300 ft of SR 64. Regardless of traffic volume, even at the lowest levels, pronghorn
distribution within 660 ft of the highway was low, with all combined probabilities less
than 0.07 (Figure 18). In the 990–1320 ft distance bands, the mean combined probability
of occurrence dropped from 0.28 at less than 100 vehicles per hr but stayed relatively
constant thereafter (0.20–0.21) up to 400 vehicles per hr, with a slight drop to 0.13 at
400–500 vehicles per hr. In the 1980 ft distance band, the mean probability of pronghorn
occurring here increased from 0.07 at less than 100 vehicles per hr to 0.13 at just 100–
200 vehicles per hr, and up to 0.16 at 500–600 vehicles per hr (Figure 18).
The proportion of pronghorn GPS approaches made to within 0.15 mi of SR 64 (n = 951)
varied throughout the day. Nearly half the approaches (48 percent) occurred between
16:30 and 19:00, when traffic was at its highest level during the day. During the morning
hours (05:30–10:00 hr), 18 percent of the approaches occurred, as did an equal proportion
of approaches made during midday hours (10:00–16:30).
5.3. WILDLIFE-VEHICLE COLLISION RELATIONSHIPS
From 2007 through 2009, DPS highway patrol officers and research team members
recorded 157 WVCs involving elk and mule deer along the SR 64 study area (Table 5).
Elk accounted for 63 percent (n = 99) of these WVCs, followed by mule deer, which
accounted for 35 percent (n = 58). In addition, three coyotes, three rabbits and one
mountain lion, black bear, and badger each were involved in WVCs during the study
period. No collisions involving pronghorn were recorded. In total, 77 WVCs were
recorded in 2007 (46 elk, 28 deer, 4 other), 51 in 2008 (33 elk, 16 deer, 2 other), and
40 in 2009 (20 elk, 14 deer, 3 other). DPS highway patrol accident reports indicated that
27 human injuries occurred in WVCs during the study.
Table 5. WVCs Involving Elk and Mule Deer on SR 64 Sections from 2007 through
2009, including the Total Number and Mean Collisions (per Mile).
SR 64
section
Elk collisions
Deer collisions All collisions
Total
Mean
(per mile)
Total
Mean
(per mile)
Total
Mean
(per mile)
A 26 1.3 30 1.6 56 2.9
B 4 0.5 0 – 4 0.5
C 0 – 0 – 0 –
D 13 1.4 3 0.3 16 1.8
E 56 4.7 25 2.1 81 6.8
All 99 1.9 58 1.2 157 3.1

52
Figure 18. Mean Probability That GPS-Collared Pronghorn Occurred within 330 ft
Distance Bands along SR 64 at Varying Traffic Volumes.

53
Section E (MP 223.4 to MP 235.4) had the highest incidence of elk and deer collisions, as
well as collisions per mile and more than twice the collisions per mile than Section A
(MP 185.5 to MP 204.7; Figure 19); these sections account for the highest density elk and
deer range along SR 64 (Figure 3). The spatial association between elk-vehicle collisions
and crossings at the 1.0 mi scale was significant (r = 0.811, n = 27, P < 0.001), as was the
association for deer (r = 0.705, n = 10, P = 0.022).
Figure 19. Frequency of Elk and Mule Deer Collisions with Vehicles by SR 64
Milepost from 2007 through 2009.
From 1998 through 2008, 41.7 percent of all single-vehicle accidents recorded along
SR 64 involved wildlife, compared with the national average of just 4.6 percent (Huijser
et al. 2007; Figure 20). The proportion of accidents involving wildlife (recorded by MP)
was as high as 87 percent (MP 233), with wildlife-related accidents accounting for more
than 75 percent of all single-vehicle accidents along five mileposts (all from MP 229 to
MP 234; Figure 20).
For accidents where time was reported by DPS, the incidence of elk and deer collisions
varied considerably among time periods (Table 6; Figure 21). The highest proportion of
elk collisions (50 percent) occurred from 5:00 p.m. to 10:00 p.m., followed by 39 percent
from 11:00 p.m. to 04:00 a.m. Only 11 percent of elk accidents occurred from 05:00 to
10:00 a.m., and none were recorded from 11:00 a.m. to 4:00 p.m. The observed
frequency of elk-vehicle collisions by time period differed from expected values (
2
=
62.5, df = 3, P < 0.001).

54
Figure 20. Proportion of SR 64 Single-Vehicle Accidents by Milepost from 1998
through 2008 that Involved Wildlife.
The negative association between the occurrence of elk-vehicle collisions and traffic
volume by hour was significant (r = -0.723, P = 0.001) in spite of the disproportionately
low incidence of collisions that occurred in the morning when traffic volume was low
(Figure 21).
The timing of deer-vehicle collisions was more variable than those for elk (Table 6;
Figure 21), though the observed frequency differed significantly from the expected by
time period (
2
= 26.8, df = 3, P < 0.001). Though 49 percent of accidents involving deer
occurred during the evening, only 8 percent occurred at night when traffic volume was
lowest. Conversely, during the times of the day when traffic volume was at its highest,
late morning and midday, a combined 43 percent of deer-vehicle collisions occurred
(Figure 20), partly accounting for the poor association between deer collisions and traffic
volume (r = 0.016, P = 0.941).
The incidence of elk collisions by day of the week did not vary significantly (P = 0.800),
though there were fewer collisions on Thursday than other days (Figure 22). For deer,
however, the incidence of collisions on Monday was more than double that of the other
six days, and the observed frequency of collisions by day was marginally different from

55
what was expected (
2
= 11.5, df = 6, P = 0.075). Neither association between both elk
and deer collisions versus mean daily traffic volume was significant (P = 0.879 and P =
0.562, respectively).
Figure 21. SR 64 Elk and Mule Deer Collisions with Vehicles by Time of Day and
Associated Traffic Volume.

56
Figure 22. SR 64 Elk and Mule Deer Collisions with Vehicles by Day
and Associated Traffic Volume.
There was a significant difference in the observed versus expected frequency of elk-
vehicle collisions by season (Table 7;
2
= 17.4, df = 2, P < 0.001). The driest season,
early spring–summer (April–July), accounted for 43 percent of all elk-vehicle collisions
along SR 64, while late summer–fall (August–November) accounted for another 38
percent (Table 7; Figure 23).
The association between elk collisions and mean monthly traffic volume was significant
(r = 0.789, P = 0.002). For mule deer, the incidence of collisions was relatively constant
through much of the year, except the late summer–fall season when nearly half of all
collisions occurred (Table 7; Figure 23). The association between deer-vehicle collisions
and traffic volume was not significant (P = 0.210). The association between elk crossings
and collisions by month was significant (r = 0.583, P = 0.047), as was the association for
deer (r = 0.686, P = 0.014).

57
Table 6. Frequency of Elk and Deer Collisions with Vehicles
along SR 64 by Time Period.
Time period Hours
Frequency of WVCs (%)
Elk Mule deer
Evening 17:00–22:00
47
(50.0%)
32
(49.2%)
Nighttime 23:00–04:00
37
(39.4%)
5
(7.7%)
Morning 05:00–10:00
10
(10.6)
19
(29.2%)
Midday 10:00–16:00
0
(–)
9
(13.8%)
Table 7. Frequency of Elk and Deer Collisions with Vehicles
along SR 64 by Season.
Season Months
Frequency of wildlife vehicle collisions (%)
Elk Mule deer
Winter–early spring Dec–Mar
18
(18.2%)
12
(20.3%)
Late spring–summer Apr–Jul
43
(43.4%)
18
(30.5%)
Late summer
–fall Aug–Nov
38
(38.4%)
29
(49.1%)

58
Figure 23. SR 64 Elk and Mule Deer Collisions with Vehicles by Month
and the Mean Traffic Volume.
5.4 WILDLIFE USE OF CATARACT CANYON BRIDGE
Camera monitoring of Cataract Canyon Bridge was conducted from July 2008 through
December 2009. A total of 126 wildlife images, including 13 elk and 37 mule deer, were
recorded by the four cameras in the bridge cells (Table 8).
Of the limited number of elk that approached the bridge during the study, 92 percent
successfully crossed through the bridge cells, while the remaining 8 percent turned back.
For mule deer, for which a greater number of successful crossings were recorded (n = 37)
than elk, 89 percent of crossings were successful (Table 8). For smaller mammal species,
including gray fox, raccoon, skunk, and various squirrel species, only 6 percent of these
animals went all the way through the structure, while 94 percent turned back.
The relatively low mobility of some of these species (e.g., squirrels) may have limited
their potential for crossing through the bridge. The vast majority of deer underpass use
occurred from August through October, with 89 percent of the entries into the bridge in
these three months. Elk use occurred only in October and December, with no entries the
rest of the year. Of all deer and elk bridge crossings, 64 percent occurred in the 3 hr
period from 10:00 p.m. to 01:00 a.m.

59
Table 8. Number of Animals by Species that Entered and Successfully Crossed through
Cataract Canyon Bridge on SR 64, and Success Rates.
Species
Animals entering bridge Animals crossing through bridge
Success
rate
No. Proportion No. Proportion
Elk 13 0.10 12
0.19 0.92
Mule deer
37 0.29 33
0.53 0.89
Gray fox
5 0.04 2
0.48 0.40
Raccoon
10 0.08 2
0.03 0.20
Skunk
7 0.06 1
0.02 0.14
Squirrel
54 0.43 0
– –
In addition to wildlife use of Cataract Canyon Bridge, substantial presence by people was
documented. In total, 191 humans were recorded, averaging 15.9 people per month;
29 all-terrain vehicles were recorded at the bridge. Human use of the bridge was largely
restricted to daytime hours from 10:00 a.m. to 5:00 p.m., when 75 percent of the use
occurred.
5.5 IDENTIFICATION OF PASSAGE STRUCTURE SITES
The research team used elk and mule deer highway crossings, WVCs, pronghorn
approaches, and the proportions of animals crossing or approaching within each segment,
among other criteria, to rate 95 0.6 mi segments for suitability as potential passage
structure locations. Additional criteria included land ownership and topography that
would support passage structure construction. Ratings of the 94 0.6 mi segments from
MP 185.5 to MP 235.4 for their suitability for potential passage structures ranged from
1 to 33 points (mean = 10 points) of a possible 40 points (Figure 24). The highest-rated
(33 points) 0.6 mi segment (Segment 82, MP 234.5 to MP 235.0) was on the Kaibab NF
just south of the south entrance to Grand Canyon Airport, which corresponded to the
stretch of highway with the highest proportion of elk crossings (14.3 percent;
121 crossings) and mule deer crossings (42.3 percent; 227 crossings), as well the
highest incidence of WVCs (n = 10).
The land ownership and terrain at this segment further make this site suited for a passage
structure. ADOT (2006) identified this site as warranting an overpass, though it was not
included in the preferred alternative. The next two highest-rated 0.6 mi segments scored
24 points each; one (Segment 81) was just south of the highest-rated segment, further
pointing to the importance of this area. The other was just south of the Kaibab NF–GCNP
boundary (Segment 85, Figure 24); the rating for this segment was largely tied to high elk
60
and deer crossings, though no WVCs occurred here, reflecting the 35 miles per hour
(mph) posted speed.

61
Figure 24. Ratings for 95 SR 64 0.6 mi Segments Using Wildlife Movement, WVC Data, and Other
Criteria to Determine the Location of Potential Wildlife Passage Structures. Red Bars Denote
Segments Where Underpasses Were Recommended in the 2006 Final Wildlife Accident Reduction Study
and Orange Where Overpasses Were Recommended (Table 9). The Green Bars Represent Segments
Where Additional Structures Are Recommended as a Result of This Study.
Section A
Section B
Section D
Section E
C
62
Of the 0.6 mi segments corresponding to the stretch of highway where weighted
pronghorn approach peaks occurred (Figure 14), the highest-rated segment (MP 221.9 to
MP 222.3) scored 20 points and corresponded to the location where ADOT (2006)
recommended either an underpass at MP 222.2 or an overpass at MP 222.0. Because only
one structure is needed here, the research team recommends an overpass to accommodate
pronghorn, elk, and deer passage.
The research team’s rating with the eight criteria was used to identify 11 priority wildlife
passage structure locations (Table 9; Figure 24). Of these, six were at sites conducive to
underpasses and five were at sites where the terrain was conducive to overpasses or the
target species was pronghorn, or both (Table 9). Of the nine wildlife crossing structure
locations identified by ADOT (2006) with underpass at MP 222.2 and overpass at 222.3
combined, including retrofitting of Cataract Canyon Bridge, the research team’s rating of
potential passage structure sites corroborated that passage structures were warranted at
eight of those locations (Table 9; Figure 24).
In addition to the passage structure sites recommended in all alternatives in that study
(ADOT 2006), which were based largely on WVC records and sites where the
topography could support a structure, the team identified an additional three potential
passage structure locations, including an underpass at the Kaibab National Forest, at the
Grand Canyon National Park boundary. The other two structures are overpasses
recommended for pronghorn passage in an area where the team recorded no WVC and
none was reported in ADOT (2006).
For the rated 94 0.6 mi segments, the average rating was 10.0 points, while the average
rating of the 11 segments where passage structures are recommended was 20.7 points
(Figure 24). By highway section, the average rating for Section A segments was 4.0. The
average rating for segments recommended for passage structures was 16.0. Structures
were recommended at half of the highest-rated segments, with the other half the highest-
rated segments being adjacent to the structures (Figure 24).
On Section B, the mean rating was 5.0 points, and an overpass was recommended at the
highest-rated segment, with 11 points (Figure 24). Section D segments averaged
10.0 points and the rating for the two segments with recommended structures was nearly
twice the mean, or 19.5 points (Figure 24). Section E segments rated the highest,
averaging 17.0 points; the six segments with recommended passage structures here
averaged 24.3 points (Figure 24). No structures have been recommended for Section C
due to the prevalence of human development.

63
Table 9. Wildlife Passage Structure Locations along SR 64 by Milepost and Highway Section and Types Recommended in the
Various 2006 Final Wildlife Accident Reduction Study Alternatives and Those Recommended as a Result of the Current Wildlife
Movements Study.
Passage
structure
MP
SR 64
section
Wildlife Accident Reduction
Study recommendation
Recommendation of
current study
Passage structure recommendation
justification and focus
Underpass Overpass Underpass Overpass
187.3 A Alt. A(W)-1 Yes
Existing Cataract Canyon Bridge; elk and deer
WVCs and connectivity
188.0 A Alt. A(W)-2 No
Need better spacing of passage structures
189.2 A Alt. A(W)-1 Yes
Elk and deer WVCs and pronghorn connectivity
205.0–205.5 B Yes
Pronghorn connectivity
220.0–220.5 D Yes
Pronghorn connectivity
222.2 D Alt. D(W)-1 No
Construct overpass nearby
222.3 D Alt. D(W)-2 Yes
Pronghorn connectivity
226.6 E Alt. E(W)-1 Yes
Elk and deer WVCs and connectivity
228.8 E Alt. E(W)-1 Yes
Elk and deer WVCs and connectivity
229.7 E Alt. E(W)-1 Yes
Elk and deer WVCs and connectivity
233.0 E Alt. E(W)-1 Yes
Elk and deer WVCs and connectivity
234.4 E Alt. E(W)-2 Yes
Elk and deer WVCs and connectivity
236.8 E Yes
Elk and deer WVCs and connectivity
Totals All 7 3 6 5
64
5.5.1 Passage Structure Recommendations by Highway Section
Highway Section A. The research team recommends building two passage structures on
Section A, including retrofitting Cataract Canyon Bridge as an underpass (MP 187.3), to
address elk and mule deer WVCs and to promote permeability, and an overpass at
MP 189.2 to address pronghorn permeability. Though an overpass was recommended in
ADOT (2006) at MP 188.0, along with an underpass to the north and Cataract Canyon
bridge to the south (Table 9; Figures 24 and 25), the team recommends that an overpass
be constructed at MP 189.2 in addition to Cataract Canyon Bridge because an additional
underpass will likely do little to promote pronghorn permeability and is spaced close to
Cataract Canyon Bridge (within 0.7 miles). This provides a structure every 1.5 to 2.3
miles for the stretch from I-40 to the developed area approaching Red Lake. Both passage
structure sites fall on land administered by the Kaibab NF.
Highway Section B. ADOT (2006) called for no passage structures on Section B,
reflecting the lower incidence of elk and deer WVCs, widespread human development
along portions of the section, and an absence of telemetry data for structures to promote
pronghorn permeability. The team recommends a single overpass on the segment to
address documented peak in pronghorn approaches (Figure 14) and to promote
permeability. An overpass is proposed for the most suitable site within the 0.6 mi
segment at MP 205.0 to MP 205.5 (Figure 25). Though it is recognized that constructing
a single overpass on Section B provides limited options for pronghorn use, it nonetheless
is warranted to maintain connectivity and genetic diversity on both sides of SR 64. This
site falls on Arizona State Trust lands.
Highway Section D. On Section D, ADOT (2006) recommended either an overpass or
underpass on adjacent 0.1 mi segments at MP 222.2 or MP 222.3. The research team
recommends that an overpass be considered at MP 222.3 instead of an underpass because
it will better promote pronghorn permeability along with that for elk and deer; this site
falls within the highest peak approach zone for pronghorn (Figures 14 and 26). The team
also recommends that another overpass be considered in the 0.6 mi segment at MP 220.0
through MP 220.59 corresponding to a zone of peak pronghorn approaches and spaced
approximately 1.8 to 2.3 miles from the other overpass, depending on the actual location.
Both overpass sites lie on Arizona State Trust lands.
Highway Section E. Along Section E, ADOT (2006) recommended integration of four
underpasses and an overpass into future highway reconstruction. The research team’s
rating of 0.6 mi segments concurs with these recommendations, including an overpass
that was not included in the preferred alternative in ADOT (2006). Also, the team
recommends the addition of a fifth underpass near the GCNP boundary, at MP 236.8,
corresponding to a high mule deer and elk use area with permanent water; the topography
here is conducive to an underpass. Other underpasses located at MP 226.6, MP 228.8,
MP 229.7, and MP 233.0 correspond to highly rated 0.6 mi segments (Figures 24 and 26)
and topography (drainages) conducive to underpass integration into future highway
reconstruction.

65
Figure 25. Recommendations for SR 64 Wildlife Passage Structures and Wildlife Fencing
for Highway Section A (Left) and Section B (Right).

66
Figure 26. Recommendations for SR 64 Wildlife Passage Structures and Wildlife
Fencing for Highway Sections D and E.
67
The overpass recommended at MP 234.4 corresponds to the highest-rated 0.6 mi segment
along SR 64 (Figure 24). The high incidence of elk and mule deer crossings and WVCs
here may reflect a funneling effect associated with Grand Canyon Airport’s fenced
perimeter.
Further, this location may be in conflict with long-range plans by ADOT’s Facilities
Management - Grand Canyon Airport, to build another access point and parking area
south of the existing entrance, as reflected in ADOT (2006). As such, depending on
terrain suitability, the overpass may be constructed as far south as possible; if the terrain
is conducive to an underpass, then consider this as an option to an overpass. The spacing
between these five structures ranges from 4.3 miles between the structure on Section D at
MP 222.3 and the southernmost structure on Section E at MP 226.6 to 0.9 miles between
structures at MP 222.8 and MP 229.7 (Figure 26). The average spacing between these
structures on Section D and E is 2.3 miles. All six recommended passage structures on
Section E lie on Kaibab NF land.
68
69
6.0 DISCUSSION
The research team’s wildlife movement and WVC assessment were greatly aided by the
proactive earlier effort documented in ADOT (2006) which was commissioned by
ADOT. The results of this study confirmed and complemented that study, providing more
refined data to support passage structure locations, especially for pronghorn for which no
WVC data existed.
Dodd et al. (“Evaluation of Measures,” 2007) advocated utilizing WVC data where it
exists as a surrogate to costly GPS telemetry movement data to plan and identify
locations for wildlife passage structures, as they found that the spatial incidence of WVCs
was strongly associated with GPS-determined highway crossings. This project further
confirms the utility of WVC data for locating wildlife passage structures, as eight of nine
(89 percent) recommended passage structure locations using WVC data in ADOT (2006)
were confirmed as being warranted by telemetry in this study; the ninth was not
recommended only for spacing (and cost) considerations.
The team found that the associations between SR 64 crossings and vehicle collisions for
both elk and mule deer were significant, explaining 66 percent and 49 percent of the
variation between the two factors, respectively. This further underscores the utility of
WVC data, with GPS telemetry playing a role in helping refine passage structure and
fencing locations. And in the instance of pronghorn, for which the highway constitutes a
passage barrier to the degree that pronghorn-vehicle collisions do not occur, GPS
telemetry data was essential to developing informed, data-driven recommendations for
passage structure placement, as done previously by Dodd et al. (2011) on US 89.
This study served to expand the collective understanding of road ecology and wildlife-
highway relationships, benefiting from consistent, comparable methodologies and metrics
to assess wildlife permeability and traffic volume relationships. The SR 64 study on elk,
mule deer, and pronghorn conducted under a different set of experimental conditions
(e.g., traffic volume patterns, habitat conditions) complements previous GPS telemetry
research on elk and white-tailed deer (Dodd et al. “Effectiveness of Wildlife,” in review,
Gagnon et al. 2010) and pronghorn (Dodd et al. 2011).
6.1 WILDLIFE PERMEABILITY
The mean SR 64 elk passage of 0.44 crossing per approach was similar to that (0.50)
obtained from extensive telemetry (100 GPS collared elk) along SR 260 (Dodd et al.
“Effectiveness of Wildlife,” in review). However, the mean SR 260 passage rate on two-
lane control sections similar to SR 64, but with higher AADT (approximately 8700
versus 4300 vehicles per day), was 52 percent higher than the SR 64 average.
The SR 260 elk crossing rate of 0.26 crossings per day, which was consistent across all
SR 260 construction classes and treatments, was more than twice the SR 64 mean of only
0.12 crossings per day. The lower elk passage and crossing rates for SR 64 are surprising
considering the dearth of traffic during much of the nighttime, especially compared to
SR 260. The lower crossing rate can partly be explained by the absence of attractive wet
70
meadow/riparian foraging areas that largely account for SR 260 elk movement and WVC
patterns (Manzo 2006, Dodd et al., “Evaluation of Measures,” 2007). These areas
resulted in seasonally higher elk tolerance to increasing traffic in pursuit of high-quality
forage (Gagnon et al. “Traffic volume alters,”2007).
However, the presence of elk along SR 64 was heavily tied seasonally to the limited
permanent water sources adjacent to the highway, accounting for a combined 80 percent
of the crossings during late spring and summer when water demand was highest. Yet the
lack of wet, attractive foraging habitats does not solely explain why the SR 64 passage
rate was lower than SR 260 when traffic volume was so low during much of the peak elk
activity period, though the passage rate was greater than 0.70 crossing per approach from
02:00 to 06:00. Even with lower crossing rates reflecting a lack of an “incentive” to cross
SR 64 like SR 260 (Gagnon et al. “Traffic volume alters,”2007), the passage rate during
low volume periods would have been expected to be higher.
The mean passage rate for mule deer along SR 64 was higher than that for elk, 0.54
crossings per approach, as was the mean crossing rate of 0.26 crossings per day. These
rates were dramatically higher than those for white-tailed deer along SR 260, where the
mean control section passage rate was just 0.03 crossing per approach and the crossing
rate was 0.02 crossings per day. Mule deer were located near the highway to a relatively
high degree, with over half of all GPS fixes occurring within 0.6 miles of SR 64.
Though the research team tried to collar deer along the entire length of Section E, only a
small proportion (3 of 13 deer) was captured south of Grand Canyon Airport. This partly
explains why 87 percent of the mule deer crossings occurred in the 2.5 miles between the
airport and the GCNP boundary, encompassing the community of Tusayan. The three
deer captured south of the airport did not cross north of the airport and accounted for only
36 crossings, 6 percent of the total.
Though the mean passage rate (0.63 crossings per approach) for these three deer was
higher than the overall mean, their mean crossing rate (0.16 crossings per day) was
38 percent lower than the overall mean. Thus, deer near the airport and Tusayan appeared
to cross at a higher rate, likely reflecting the lower posted speed limit (55 mph),
habituation to humans, and presence of permanent water sources.
Similar to the findings of Dodd et al. (2011) for GPS-collared pronghorn along US 89,
the pronghorn passage rate along SR 64 was also negligible, 0.004 crossings per
approach, as was the crossing rate at 0.001 crossings per day. With only one of 15
animals crossing the highway three times, SR 64 constitutes a near barrier to pronghorn
passage and accounts for the lack of pronghorn-vehicle collisions recorded in 12 years.
Prior VHF telemetry studies in northern Arizona have demonstrated paved highways with
fenced ROW constitute near total barriers to pronghorn passage. Ockenfels et al. (1994)
found that individual pronghorn never occurred on opposite sides of Interstate 17, and
Ockenfels et al. (1997), van Riper and Ockenfels (1998), and Bright and van Riper
(2000) never documented a pronghorn crossing of fenced ROW adjacent to US 89, I-40,
71
or US 180. These studies point to the combined impact of fenced ROW and highways,
though it is difficult to partition their contributory impact on pronghorn permeability.
Sheldon (2005) found that fences in Wyoming significantly influenced pronghorn
movements and distribution, and that home ranges were located in areas exhibiting the
lowest fence densities. The presence and type of ROW fences determined whether roads
were included in seasonal ranges and where pronghorn crossed highways. Sheldon (2005)
found that seasonal crossings consistently occurred along unfenced highway sections.
Based on the reduced permeability found for elk along SR 260 associated with highway
reconstruction compared with research controls (Dodd et al. “Evaluation of Measures,”
2007) and as predicted by Jaeger et al. (2005), the team assumed that elk (and deer)
permeability likely will be reduced along SR 64 as the highway is upgraded from a
narrow two-lane to a four-lane divided highway. However, as demonstrated for elk and
white-tailed deer along SR 260, effective passage structures with adequate spacing can
significantly mitigate the impact of the highway reconstruction as well as reduce WVCs
(Dodd et al. “Effectiveness of Wildlife,” in review).
6.2 WILDLIFE DISTRIBUTION AND TRAFFIC RELATIONSHIPS
The pattern of elk, mule deer, and, to a lesser degree, pronghorn distribution with
fluctuating traffic along SR 64 is broadly consistent with road-impact models with
reduced “habitat effectiveness,” as reflected in diminished use of available habitat near
roads (Lyon and Christensen 1992).
The availability of habitat within 990 ft of the highway, as measured by probability of
presence by all three species, was clearly reduced at higher traffic volumes, with the
mean proportion for the three species dropping nearly in half—from 0.34 at less than 100
vehicles per hr to 0.19 at 200 to 300 vehicles per hour (4800–7200 AADT equivalent).
However, the fact that elk and deer returned to areas adjacent to the highway, including
to within 330 ft, in proportions greater than 0.12 when traffic volumes were low indicates
that the relative temporary reduction in habitat effectiveness depends on the duration of
higher traffic volumes.
Other studies of lower volume roadways have similarly documented that elk and mule
deer distribution shifted away from areas close to roads and that this response increased
with higher traffic volume (Rost and Bailey 1979, Witmer and deCalesta 1985, Rowland
et al. 2000, Wisdom et al. 2005, Wisdom 1998). Likewise, studies of low-volume roads
demonstrated that elk and deer were often farther from roads during the day and came
nearer roads during the night (Wisdom 1998, Ager et al. 2003), suggesting a short-term
temporal response to lower nighttime traffic volumes.
These results also are consistent with theoretical models that suggest that highways
averaging 4000 to 10,000 vehicles per day present strong barriers to wildlife and would
repel animals away from the highway (Iuell et al. 2003, Mueller and Berthoud 1997). The
highest levels of permeability (passage rates greater than 0.70 crossings per approach)
occurred at night when traffic was lowest. Paradoxically, the tendency for elk to move
72
close to the highway at lower traffic volumes appeared to contribute to increased
incidence of elk-vehicle collisions when traffic volumes were lowest.
This study added to the understanding of the pronghorn-traffic relationships reported for
US 89 by Dodd et al. (2011). Whereas most deer and elk crossings occur at night when
traffic volume is lowest, pronghorn are diurnal and active when traffic volumes are
typically at their highest, and SR 64 was no exception. Pronghorn uniformly avoided
habitats adjacent to SR 64 (within 330 ft), thus reflecting a permanent loss in habitat
effectiveness. Also, in the absence of attractive habitats adjacent to the highway, as
reported for elk by Gagnon et al. (“Traffic volume alters,”2007), SR 64 pronghorn lacked
an incentive or attractant to tolerate even the impact of relatively low traffic volumes.
Whereas Reeve (1984) reported that regular vehicular traffic produced minimal
disturbance among pronghorn due to habituation, the research team believes that
pronghorn along SR 64 are consistently negatively impacted by traffic volume at even
low levels, though this seldom occurs in the daytime when pronghorn are most active.
During periods when peak daytime traffic volumes approach 10,000 vehicles/day,
especially in the summer, highways become strong barriers to wildlife passage (Mueller
and Berthoud 1997). Pronghorn appear more sensitive to traffic volume impact than elk
and mule deer, and their avoidance of the area adjacent to the highway is problematic in
terms of implementing effective passage structures to promote permeability. In Alberta,
pronghorn close to roads across all traffic levels exhibited higher vigilance levels, further
suggesting an overall perception of risk toward roads (Gavin and Komers 2006).
6.3 WILDLIFE-VEHICLE COLLISION RELATIONSHIPS
The incidence of WVCs along SR 64 is a significant and growing issue affecting highway
safety. The incidence of ungulate (elk and mule deer) WVCs in this study (52.0 per year)
was an increase from the 36.7 per year reported between 1991 and 2003 in ADOT
(2006). However, the WVC rate along Section E remained nearly constant, at 2.2
collisions per mile per year from 1991 to 2003, compared with 2.3 collisions per mile per
year from 2007 through 2009, but dropped from accounting for 70 percent of all SR 64
WVCs between 1991 and 2003, to a 52 percent contribution in this study.
Section A accounted for 28 percent of all WVCs in the study area from 1991 to 2003 but
36 percent during the study, pointing to the need for management actions to mitigate
WVCs on this section as well as Section E. The rate of elk-vehicle collisions along
Section E during the current study (1.6 per mi per year) was comparable to the mean for
SR 260 sections before reconstruction (1.2 per mi per year; Dodd et al. “Effectiveness of
Wildlife,” in review), as well as rates reported in previous studies in North America,
including Alberta (Gunson and Clevenger 2003), British Columbia (Sielecki 2004), and
New Mexico (Biggs et al. 2004).
Traffic volume has frequently been reported as a factor contributing to WVCs for a wide
range of wildlife (Inbar and Mayer 1999, Joyce and Mahoney 2001, Forman et al. 2003).
However, the research team observed a significant negative association between elk-
73
vehicle collisions and traffic volume. Gunson and Clevenger (2003) also found that mean
elk-vehicle accidents declined as traffic volume increased (r
2
= 0.82), and Brody and
Pelton (1989) reported a negative relationship between black bear crossings and traffic
volume, as did Waller and Servheen (2005) for grizzly bears.
These results run counter to Waller et al. (2006), who developed probabilistic measures
of road mortality and theorized that highway lethality was related to traffic volume and
time spent on the roadway by crossing animals. On SR 64, elk passage rates and
occurrence within 330 ft of the highway were highest when traffic volume was lowest.
When traffic was low, elk were often observed adjacent to the roadway feeding on
vegetation deemed more attractive due to increased moisture runoff from the pavement as
well as deicing salt applied during the winter. This proximity of elk to the roadway likely
contributed to making elk (and motorists) vulnerable to collisions. Also contributing to
higher collision incidence with elk at night were poor visibility conditions and increased
vehicular speeds.
The large proportion of elk-vehicle accidents that occurred during the evening hours
(39 percent) is consistent with the 31 percent documented along SR 260 by Dodd et al.
(“Evaluation of Measures,” 2007). Gunson and Clevenger (2003) and Biggs et al. (2004)
noted similar evening peaks in elk-vehicle collisions. Though SR 64 mule deer-vehicle
collision incidence and traffic volume were not associated with a large portion of
collisions during the day, nearly half of the collisions occurred at night as traffic volume
diminished.
Haikonen and Summala (2001) reported that a large peak in WVCs—46 percent of
moose collisions and 37 percent of white-tailed deer collisions—occurred within 3 hours
after sunset, tied to circadian rhythms associated with light. Dodd et al. (“Evaluation of
Measures,” 2007) found that 55 percent of elk and 50 percent of white-tailed deer
collisions along SR 260 occurred within 2 hr of sunrise and sunset (Dodd et al.,
“Evaluation of Measures,” 2007), similar to the high evening WVC incidence along
SR 64.
The highest proportion of elk-vehicle collisions and elk highway crossings occurred in
late spring–summer, when water was most limited. Elk likely crossed SR 64 to seek
water at the limited permanent water sources along Section E as well as to seek forage
along the roadway. Late summer–fall accounted for a large proportion of SR 64 elk-
vehicle collisions.
Dodd et al. (“Evaluation of Measures,” 2007) recorded the largest proportion of elk-
vehicle collisions along SR 260 tied to the breeding season and an influx of migrating
elk. Gunson and Clevenger (2003) reported an increase in elk-vehicle collisions in fall
attributable to increased elk numbers from calf recruitment, and Biggs et al. (2004)
reported increased collisions in fall. Nearly half of SR 64 deer-vehicle collisions occurred
in the late summer–fall. Romin and Bissonette (1996), Hubbard et al. (2000), and Puglisi
et al. (1974) attributed increased deer collisions in fall to breeding and sport hunting.
74
Huijser et al. (2007) conducted an extensive review of costs associated with WVCs,
including costs associated with vehicle property damage, human injuries and fatalities,
removal and disposal of carcasses, and loss of recreational value associated with vehicle-
killed animals. They reported the cost associated with each elk-vehicle collision to be
$18,561 and each deer-vehicle collision to be $8388.
Using these figures and the WVC data from 2007 through 2009, the research team
estimated the annual cost associated with SR 64 vehicle collisions with elk and mule deer
to be $612,500 and $162,200 respectively, for a combined annual cost of $775,000. Over
a 20 year period, assuming the WVC incidence remained unchanged or unmitigated, the
cost from WVCs would total more than $15.5 million in current dollars.
6.4 CATARACT CANYON BRIDGE WILDLIFE USE
Dodd et al. (“Video surveillance to assess,” 2007) used complex and costly four-camera
video systems at several SR 260 underpasses to document wildlife use and behavioral
response while approaching and crossing through the structures.
The single-frame Reconyx
™
cameras with capability to record five frames per second that
were used in this project constituted a cost-effective and reliable alternative to video
camera systems, and the placement of cameras high on the bridge abutments successfully
deterred theft and vandalism even though there was substantial human presence at the
bridge. However, the team was not able to effectively measure wildlife passage rates as
per Dodd et al. (“Video surveillance to assess,” 2007) using these cameras, and high use
of Cataract Canyon Bridge by people would likely have rendered a video camera system
vulnerable to vandalism and theft.
Relative to the number of elk- and deer-vehicle collisions recorded near Cataract Canyon
Bridge, coupled with the relatively high density of both species along this stretch of the
study area (Figure 3), the documented wildlife use of the bridge for passage was nominal,
especially compared with the number of deer and elk recorded on videotape at SR 260
underpasses (more than 15,000). However, without ungulate-proof fencing to limit at-
grade crossings and funnel animals to the bridge, the research team’s expectation for
significant use was low.
At SR 260 wildlife underpasses before fencing was erected, the elk and deer passage rate
was only 0.12 crossings per approach; most animals continued to cross the highway at
grade. Once fencing was erected to funnel animals, the passage rate jumped to 0.64
crossings per approach, with no at-grade crossings by deer and elk (Dodd “Evaluation of
Measures,” 2007). ADOT was willing to accommodate the research objectives by
erecting ungulate-proof fencing north and south of Cataract Canyon Bridge while doing a
ROW fence replacement project. However, various logistical challenges, such as
preventing wildlife end run effects at each end of the fence that could exacerbate the
WVC situation, precluded the erection of ungulate-proof fencing near Cataract Canyon
Bridge. As such, it is not surprising that so few elk and deer used the bridge for passage.
75
Despite the limited number of animals captured on cameras using Cataract Canyon
Bridge, the research team believes the bridge has the potential to be a highly effective
retrofitted wildlife passage structure (underpass). The high success rates for mule deer
and elk that approached the bridge cells and crossed through (more than 0.89 crossings
per entry for both) indicate that ungulates readily accept and use the structure with
minimal behavioral resistance to passage; a similar response could be expected once
fencing is erected to funnel more animals to and through the bridge.
Cataract Canyon Bridge exceeds the structural and placement guidelines for effective elk
and mule deer passage structures recommended by Reed et al. (1975), Gordon and
Anderson (2003), and Gagnon et al. (2011). The high level of human use of the bridge
likely will not substantially impact or limit effective wildlife use of the structure, as noted
in similar situations by Clevenger and Waltho (2000). Gagnon et al. (2011) found no
conflict in wildlife and human use of a dual-use underpass along SR 260 linking two
communities; nearly all wildlife use occurred in the evening and at night, while human
use occurred exclusively during the day. However, it is important to note that avoiding
dual-use structures for diurnal species such as pronghorn and bighorn sheep is essential to
the success of the structures.
6.5 IDENTIFICATION OF PASSAGE STRUCTURE SITES
Integration of wildlife passage structures in transportation projects has shown
considerable benefit in reducing the incidence of WVCs and promoting wildlife passage
across highways (Foster and Humphrey 1995; Farrell et al. 2002; Clevenger and Waltho
2003; Gordon and Anderson 2003; Dodd et al., “Assessment of elk,” 2007; Gagnon et al.
2011). Critical to the effectiveness of passage structures in achieving desired use by
wildlife is their structural design; placement relative to terrain, topography, and habitat;
spacing between structures; and effective integration of fencing. Failure to address any
one of the factors could diminish a structure’s effectiveness in achieving wildlife use.
6.5.1 Passage Structure Design Considerations
The efficacy of promoting wildlife connectivity and WVC reduction has been especially
well documented for elk (Clevenger and Waltho 2003; Dodd et al., “Evaluation of
Measures,” 2007; “Effectiveness of Wildlife,” in review) and mule deer (Reed et al.
1975, Gordon and Anderson 2003, Plumb et al. 2003). Gagnon et al. 2011 reported on the
adaptive capability of elk in using wildlife underpasses with a range of design
“limitations,” taking four years to achieve nearly equal use of underpasses. This learning
and habituation by elk also was stressed by Clevenger and Waltho (2003). Mule deer
appear to have similar learning capability (Reed et al. 1975, Clevenger and Waltho 2003,
Gordon and Anderson 2003), though this has not been as rigorously addressed as for elk.
Passage structures have proved effective for elk, deer, and other species, but their
application to promote pronghorn permeability has been limited (Sawyer and Rudd
2005). Though Plumb et al. (2003) documented 70 crossings by pronghorn at a concrete
box culvert underpass in Wyoming (81 percent in a single crossing), pronghorn overall
exhibited reluctance to use the structure, and the majority of crossing pronghorn
76
accompanied mule deer through the underpass. Crossing pronghorn composed a small
portion of the local pronghorn herd. In six years of monitoring Interstate 80 underpasses,
through which thousands of mule deer passed, only a single pronghorn was recorded
passing through the structures monitored by Ward et al. (1980).
Despite the limited use of structures to date, there is recognition of the need for special
strategies to promote pronghorn permeability (Ockenfels et al. 1994, Hacker 2002,
Yoakum 2004, Sawyer and Rudd 2005, Dodd et al. 20011). Sawyer and Rudd (2005:6)
reported that “with the exception of Plumb et al. (2003) and several anecdotal
observations, we could not find any published or documented information on pronghorn
utilizing crossing structures.” Still, they believed that large open-span bridged
underpasses might be more effective in promoting pronghorn passage than overpasses,
though no studies have been done to support this contention.
To date, no passage structure intended for pronghorn passage has been implemented in
North America. In urging long-term studies to evaluate passage structure effectiveness in
promoting population and genetic viability to justify overpass application in highway
projects given their high cost, the recommendation of Corlatti et al. (2009) is particularly
relevant to pronghorn given the limited application of passage structures.
Structural design characteristics have a significant bearing on the eventual use and
acceptance of passage structures by wildlife (Foster and Humphrey 1995; Clevenger and
Waltho 2003; Gordon and Anderson 2003; Ng et al. 2004; Dodd et al., “Assessment of
elk,” 2007; Gagnon et al. 2011). Most important is the requirement that any type of
structure considered to promote passage be as open and wide as possible (Ruediger 2002,
Sawyer and Rudd 2005), with special attention paid to avoiding obstructed line-of-sight
views through or across structures (Foster and Humphrey 1995; Sawyer and Rudd 2005;
Dodd et al., “Evaluation of Measures,” 2007; Gagnon et al., 2011). This is especially the
case for pronghorn because this species’ adaptation to an open plains/grassland
environment has resulted in a strong survival reliance on visual stimuli and avoidance of
dense habitats and situations that restrict their view or mobility (Hart et al. 2008).
Though Yoakum (2004) questioned the ability to achieve pronghorn use of passage
structures across high traffic volume roadways due to behavioral characteristics
(e.g., highway avoidance), Sawyer and Rudd (2005) concluded that properly designed
and located structures could be effective. Rather than overpasses, they favored wide
(more than 60 ft between bridge supports) and high (more than 24 ft) open-span
bridge/underpass structures, and in recognizing the lack of insights for pronghorn
passage, believed underpasses to have the widest application and lower cost, also helping
address drainage needs.
The research team stresses that topography and the maximization of visual continuity for
pronghorn are also critical concerns that may make overpasses attractive, applicable, or
both along certain SR 64 locales. Most wildlife underpasses implemented along SR 260
that have proved so successful in promoting elk and deer passage (Gagnon et al. 2011)
would not function well for pronghorn passage. In addition, no similar wide-open
topographic features in which to situate underpasses are within the high-use pronghorn
77
areas along SR 64—a strong selling point made by Sawyer and Rudd (2005) for
underpasses.
With the impact evident from high daytime traffic on SR 64, including visual and noise
impacts to pronghorn (Mueller and Berthoud 1997), comprehensive measures to reduce
traffic-associated impacts could create “quiet zones” along the highway corresponding to
passage structures, especially for pronghorn overpasses. Such quiet zones could facilitate
pronghorn approaching (and successfully crossing) the highway and play a potentially
significant role in promoting passage.
A comprehensive set of measures to reduce traffic-associated impacts should include
incorporation of highway design, noise barriers that do not restrict movements, and
pavement treatments (Kaseloo and Tyson 2004). In conjunction with passage structure
construction, highway approaches to the structure could be recessed below grade to
reduce noise impact while supporting overpass construction. Soil berms or sound walls
adjacent to passage structures may be warranted to help reduce traffic impact, as well as
to visually shield pronghorn from traffic. Such barriers could reduce traffic noise by as
much as half, depending on their height (Federal Highway Administration 2001).
Vegetation atop berms could further shield traffic-associated noise, as would rubberized
asphalt application on the pavement near passage structures. Without a comprehensive
effort to reduce noise impact, the success of passage structures could be compromised by
continued pronghorn avoidance of approaching the highway at high traffic volumes
(Mueller and Berthoud 1997, Yoakum 2004).
A variety of passage structure types may be considered for application along SR 64
(Figure 27), including single-span bridges used effectively along SR 260 as underpasses,
cost-effective multi-plate arch underpasses, and CON/SPAN
®
pre-cast concrete arches
that can span 60 ft with various heights up to 24 ft and widths up to and exceeding 100 ft;
these overpass structures can be integrated into existing terrain, as recommended for
US 89 (Dodd et al. 2011), or constructed as a stand-alone structure (Figure 27).

78
Figure 27. Various Wildlife Passage Structure Options for SR 64, Including
CON/SPAN
®
Pre-Cast Concrete Arches for Overpasses, with a Rendering of a Pronghorn
Overpass on US 89 Integrated into Cut Slopes (Top Left) and a Stand Alone Overpass on
US 93 in Montana (Top Right), Single-Span Bridged Underpasses Similar to Those Used
on SR 260 (Center), and Corrugated Multi-Plate Arch Underpasses Used along US 93 in
Montana (Bottom).
79
6.5.2 Role of Passage Structure Spacing
The spacing of wildlife passage structures has a potentially significant impact on the
ability to promote highway permeability (Olsson 2007, Bissonette and Adair 2008, Dodd
et al. “Effectiveness of Wildlife,” in review, Gagnon et al. 2010). Bissonette and Adair
(2008) recommended spacing based on isometric scaling of home ranges: 2.0 miles
between passage structures to accommodate pronghorn permeability, 1.1 miles for mule
deer, and 2.2 miles for elk. However, Dodd et al. (“Effectiveness of Wildlife,” in review)
and Gagnon et al. (2010) reported that the spacing of 2.2 miles between passage
structures for elk may be high because elk passage rates along reconstructed SR 260
highway sections dropped off dramatically above 1.6 miles spacing.
The research team recommends spacing passage structures 1.5 to 2.3 miles apart on
Section A (elk, deer, and pronghorn), 1.8 to 2.3 miles apart on Section D (pronghorn),
and 2.3 miles apart on Section E (elk and deer); however, the lower end of these ranges
will provide more effective permeability.
The team’s recommendations for elk and pronghorn are generally consistent with those
made by Bissonette and Adair (2008). Dodd et al. (2011) recommended 3.2 miles spacing
between passage structures for pronghorn on US 89, reflecting daily movements and
linear distance traveled. The team’s recommended spacing distance along SR 64 is
double that recommended for mule deer by Bissonette and Adair (2008).
However, the considerably larger mean home ranges measured for all three species along
SR 64, especially for mule deer (excluding the five animals that exhibited long-distance
movements), was more than 15 times the size reported by Bissonette and Adair (2008).
This suggests that the recommended spacing may be adequate; regardless, the topography
on Sections A and D effectively preclude additional cost-effective passage structures to
achieve closer spacing.
6.5.3 Role of Fencing
Several studies point to the integral role that 6.5 to 8 ft ungulate-proof fencing plays in
achieving highway reconstruction objectives for minimizing WVCs and promoting
highway safety, as well as promoting wildlife permeability (Dodd et al., “Evaluation of
Measures,” 2007; “Effectiveness of Wildlife,” in review). This important role of fencing
in conjunction with passage structures has been stressed by Romin and Bissonette (1996),
Forman et al. (2003), and others, and the empirical basis for fencing’s role in reducing
WVCs has continued to grow, with reductions in WVCs of anywhere from 80 percent
(Clevenger et al. 2001) to more than 90 percent (Ward 1982, Woods 1990, Gagnon et al.
2010).
Conversely, some mixed results have been reported (Falk et al. 1978), especially where
animals cross at the ends of fencing, resulting in zones of increased incidence of WVCs
(Woods 1990, Clevenger et al. 2001), an important consideration in determining where to
terminate fencing. Fencing is costly and requires substantial maintenance (Forman et al.
2003), often making it difficult for transportation officials to justify fencing long
80
stretches of highways. However, failure to erect adequate fencing in association with
passage structures, even when adequately spaced, was found to substantially mitigate
their effectiveness in reducing WVCs and promoting permeability (Dodd et al.,
“Evaluation of Measures,” 2007; “Effectiveness of Wildlife,” in review).
Fencing in conjunction with pronghorn passage structures presents a unique situation
compared with elk and mule deer. Pronghorn evolved in open plains/grassland
environments where speed and mobility was their defense against predators (Hart et al.
2008). Pronghorn have exhibited limited ability to adapt to fences like elk and deer.
Whereas fencing has been instrumental in preventing at-grade highway crossings and
funneling animals to passage structures to reduce WVCs and promote permeability such
an approach may not be necessary for pronghorn that exhibit virtually no at-grade
highway crossings or collisions with vehicles in Arizona (Clevenger et al. 2001, Dodd et
al. “Video surveillance to assess,” 2007).
Sawyer and Rudd (2005:18) stressed the advantage of avoiding fences altogether in
association with passage structures to promote pronghorn use. They stated that “ideally, a
crossing structure would be located in an area with no fencing. If fencing is required,
then the crossing structure should be located in an area where fence design is pronghorn-
friendly and does not inhibit pronghorn movements to and from the structure.”
On land where livestock grazing occurs (e.g., Kaibab NF, Arizona State Trust lands),
creative approaches such as pulling fences back 0.25 to 0.5 miles or resting pastures and
removing fencing could minimize the impact of ROW fences, beyond the installation of
“goat bars” (plastic pipe to the bottom strand of a fence; B. Cordasco, Babbitt Ranches,
personal communication, 2008), or raising/removing the bottom strand of barbed-wire
fences (Hart et al. 2008). ROW fencing in association with passage structures is not
needed to preclude at-grade pronghorn crossings of SR 64. Fencing would play less of a
physical funneling role than providing a visual cue as to a path of least resistance across
the highway barrier, provided no fencing is used at the mouth of the passages.
The research team’s specific recommendations for the erection of 8 ft ungulate-proof
(wildlife) fencing along SR 64 include:
Erecting fencing along Section A from MP 186.0, near the I-40 junction (with
appropriate flaring or other measures to prevent an end run onto the interstate), to
MP 189.2 at the south abutment of the recommended overpass, or 3.2miles. This
would serve to funnel elk and deer toward the two passage structures (including
Cataract Canyon Bridge) and limit the potential for an end run at the I-40 junction.
From the north abutments of the overpass at MP 189.2, extend fencing 0.9 miles
north to MP 190.1 at the Kaibab NF boundary (Figure 25).
Erecting 12.1 miles of fencing from the north abutment of the Section D overpass at
MP 222.3 to the south abutments of the overpass at roughly MP 234.4 (Figure 26).
From the northwest abutment, the fence would link into the existing 8 ft chain-link
fence around Grand Canyon Airport just south of the ADOT housing compound.
From the northeasternmost extent of chain-link fence around the airport, extend the
wildlife fence to the ROW and north to Long Jim Road. From the northeast abutment,

81
the fence would continue along the highway ROW north to Forest Road 302. Where
the fence terminates, sealing the fenced corridor to prevent breaching of the fenced
corridor could be accomplished with an electrified guard installed into the pavement
(Figure 28).
Erecting fencing in the town of Tusayan is highly problematic due to visual impact
and numerous lateral access points. With 35 mph posted speed and good visibility,
lending to the low incidence of WVCs within the developed stretch of Tusayan
wildlife fencing can be foregone within the developed portion of Tusayan,
recognizing that deer and elk will frequent this area; special warning signage may be
warranted here. Wildlife fencing should be erected on both sides of SR 64 beginning
at the north end of the developed portion of Tusayan near MP 235.5. Fencing should
continue to the underpass recommended at MP 236.8, as well as from the underpass,
terminating 0.5 miles beyond this point at the GCNP, for a total of approximately 1.8
miles (Figure 26). At the beginning of the fenced section at the north end of Tusayan,
another electrified barrier across the highway may be considered to secure the fenced
corridor (Figure 28).
Figure 28. An Electrified Barrier Installed in the Pavement to Prevent Wildlife from
Breaching the Fenced Corridor at the Fencing Terminus. This Mat was Installed on I-40
Off-Ramps in New Mexico.
82
83
7.0 CONCLUSIONS AND RECOMMENDATIONS
This project implemented a data-driven approach to quantify elk, mule deer, and
pronghorn permeability across SR 64 and to determine the best locations for potential
passage structures to reduce WVCs and enhance permeability. For pronghorn, this study
was particularly important given the lack of WVC data for the species. Key conclusions
and recommendations from this research project follow.
Recommendations are highlighted using the symbol
.
7.1 FINAL WILDLIFE ACCIDENT REDUCTION STUDY ROLE
The study effort in ADOT (2006) represents a proactive commitment by ADOT to
analyze WVC data and develop strategies to reduce WVCs and promote wildlife
passage across Arizona’s highways. This approach is especially useful in helping
prioritize and streamline highway reconstruction planning processes, including the
Design Concept Report process, to effectively address wildlife-related issues.
Assessments similar to ADOT (2006) should be accomplished on other
highways, where appropriate, to address WVCs and wildlife permeability
issues. Such assessments should be prioritized using the Arizona’s Wildlife
Linkages Assessment (Arizona Wildlife Linkages Workgroup 2006) and WVC
databases.
This project further confirms the utility of WVC data for locating wildlife passage
structures as confirmed by GPS telemetry. Eight of nine (89 percent) recommended
passage structure locations using WVC data in ADOT (2006) were confirmed as
being warranted by telemetry from this study; the ninth was not recommended only
for space (and cost) considerations. Dodd et al. (“Evaluation of Measures,” 2007)
advocated using WVC data where it exists to plan and identify locations for wildlife
passage structures, with the 0.6 mile scale showing the greatest management utility.
The research team found that the spatial association between elk-vehicle collisions
and crossings at the 1.0 mile scale was significant (r = 0.811, P < 0.001), as was the
association for deer (r = 0.705, P = 0.022). This association points to the utility of
WVC data in planning strategies to reduce WVCs and promote permeability.
ADOT and other agencies should continue committed efforts to collect and
archive spatially accurate WVC data throughout Arizona using a standardized
interagency WVC reporting system. Such an effort will provide valuable
information for future highway planning and design.
In the case of pronghorn, for which the highway constitutes such a barrier that
pronghorn-vehicle collisions do not occur, GPS telemetry data was essential to
developing informed, data-driven recommendations for passage structure placement.
84
For species for which highways constitute strong barriers to passage, such as
pronghorn, GPS telemetry studies are vital to developing strategies to promote
permeability and connectivity.
7.2 WILDLIFE PERMEABILITY AND PASSAGE STRUCTURES
GPS telemetry afforded a valuable technique to assess and compare wildlife
permeability for three ungulate species along SR 64 and to compare the results to
telemetry studies elsewhere (e.g., SR 260, US 89) for the same species under different
highway conditions. Assessments and comparisons in this study were facilitated by
the use of “passage rate” as a comparable metric for permeability (Dodd et al.,
“Assessment of elk,” 2007).
When possible, GPS telemetry should be used to document wildlife
movements to facilitate positioning passage structures and fencing in the best
available locations to ensure effectiveness, particularly for those species that
do not readily cross highways and for which limited WVC data exists (e.g.,
pronghorn).
7.2.1 Elk and Mule Deer Permeability
Elk crossed the highway 843 times, an average of 0.12 times per day, with the highest
proportion of crossings during the driest season (April–July; 60 percent). Movements
to limited water sources likely influenced movement and crossing patterns. The elk
crossing distribution was not random and exhibited several peak crossing zones,
especially at the north end of the study area. The highest proportion of crossings
occurred in late April - July (60 percent), followed by August–November
(27 percent), and December–March (13 percent).
The elk passage rate averaged 0.44 crossings per approach. This was 52 percent lower
than the rate on SR 260 sections with similar highway standards from previous
telemetry research.
Elk passage rates by 2 hour blocks ranged from 0.03 to 0.78 crossings per approach.
The passage rate between midnight and 04:00 a.m., when traffic was nearly absent
(less than 10 vehicles per hour), averaged 0.58 crossings per approach, more than two
times the mean passage rate during the rest of the day (0.28 crossings per approach).
Mule deer crossed the highway 550 times, more than twice as frequently as elk
(0.26 times per day). Seasonal deer crossings were more consistent than elk, though
46 percent of crossings occurred during August through November. The mule deer
crossing distribution did not occur in a random fashion; two peak crossing zones were
identified at the north end of the study area. Ninety-two percent of the crossings
occurred along a 3.2 mile stretch between the Grand Canyon Airport and GCNP.
The overall average mule deer passage rate (0.54 crossings per approach) was higher
than the rate for elk in this study. This passage rate was substantially higher that the
85
rate for white-tailed deer on SR 260. Unlike SR 64 elk, the deer passage rate
remained relatively high (0.61 crossings per approach) well into the morning hours.
It is anticipated that SR 64 elk and mule deer permeability levels will be impacted
with future SR 64 reconstruction, possibly to even a higher degree than reported for
SR 260 given the current lower passage rate across the two-lane highway (Dodd et
al., “Evaluation of Measures,” 2007), and consistent with predictions by Jaeger et al.
(2005). As such, measures to promote permeability, including passage structures and
fencing, will be critical once the highway is widened.
The team recommends that six wildlife underpasses and one overpass be
constructed along SR 64 to accommodate elk and deer passage; four other
overpasses are recommended to accommodate pronghorn passage, and they
too may receive use by elk and deer (Table 9; Figures 25 and 26).
Though the wildlife use documented by cameras at Cataract Canyon Bridge
was limited, the research team nonetheless believes the bridge has the
potential to be a highly effective retrofitted wildlife passage structure due to
the high passage rates for deer and elk that crossed through with minimal
behavioral resistance. The bridge also exceeds all structural and placement
guidelines for effective passage structures. The high level of human use at the
bridge should not significantly limit effective wildlife use because animal use
primarily occurs in the evening and at night, while human use occurred
exclusively in the daytime.
7.2.2 Pronghorn Permeability
SR 64 constitutes a near-total barrier to the passage of pronghorn, with only one of
15 tracked animals having crossed the highway.
The pronghorn highway crossing rate averaged 0.001 crossings per day among the
pronghorn that approached to within 0.15 miles of SR 64. The pronghorn passage rate
was negligible, only 0.004 crossings per approach. These rates were nearly identical
to those documented for pronghorn along US 89 (Dodd et al. 2011).
The barrier effect associated with SR 64, coupled with the need to maintain the
viability and size of the pronghorn population, points to the need for passage
structures to promote permeability for this species.
Two of the research team’s eleven potential passage structure locations are for
pronghorn passage, and another two are recommended at locations likely to be
used by elk and mule deer as well. At all four locations, overpasses are
preferred over underpasses to accommodate pronghorn passage because these
structures provide a greater level of openness, which is important to achieve
pronghorn use.
86
7.3 IMPACT OF TRAFFIC AND NOISE
Traffic volumes along SR 64, averaging 4275 vehicles per day, fluctuated greatly on
an hourly, daily, and seasonal basis. Traffic volumes were highest during daytime
hours. However, compared with other study areas in Arizona, SR 64 is unique in that
traffic is virtually nonexistent late at night, averaging less than 10 vehicles per hour
for a 4 hour period, reflecting the predominant tourist destination nature of motorists
traveling to and from the GCNP.
Elk, mule deer, and pronghorn distribution with fluctuating traffic was consistent with
models of road impact that resulted in reduced habitat availability within 990 ft of the
highway. The probability of presence within 990 ft of SR 64 by all three species was
clearly reduced at higher traffic volumes, with the mean proportion dropping nearly
in half, from 0.34 at less than 100 vehicles per hour to 0.19 at traffic volumes of just
200 to 300 vehicles per hour. Though elk and deer returned to areas adjacent to the
highway, including to within 330 ft, in proportions greater than 0.12 when traffic
volumes were low, the impact to pronghorn resulted in a permanent loss in habitat
effectiveness. Pronghorn uniformly avoided areas adjacent to the highway and were
consistently negatively impacted by traffic at even low levels.
The highest levels of permeability for elk and deer (passage rates greater than
0.70 crossings per approach) occurred at night when traffic was lowest. Pronghorn
appeared more sensitive to traffic volume impact than elk and deer, and their
avoidance of the area adjacent to the highway is problematic in terms of
implementing effective passage structures to promote permeability.
Pronghorn are primarily active during daytime hours when peak traffic volumes,
often approaching 10,000 AADT, occur along SR 64 and highways become strong
barriers to wildlife passage (Mueller and Berthoud 1997).
A comprehensive set of measures to reduce traffic-associated noise impact
should be employed to create “quiet zones” along the highway to facilitate
pronghorn highway approaches and crossings via passage structures. These
design measures could include; 1) recessing the roadway below grade, 2)
integrating noise barriers such as berms, 3) vegetation, 4) sound walls, and 5)
applying pavement treatments such as rubberized asphalt. Without a
comprehensive effort to reduce noise and visual impact, the potential success
of passage structures could be compromised.
7.4 PASSAGE STRUCTURE DESIGN AND PLACEMENT
Structural design characteristics and placement of passage structures are important in
maximizing their efficacy in promoting wildlife passage. SR 260 research found
underpass structural characteristics to be the most important factor in determining the
probability of achieving successful crossings by elk and deer (Gagnon et al. 2011).
Structure openness is important to achieving a high probability of successful
crossings by wildlife (Dodd et al. “Effectiveness of Wildlife,” in review). The SR 260
87
data suggest that underpass length, the distance that animals must travel through an
underpass, is an especially important factor in maximizing effectiveness.
Where possible, the length through underpasses should be minimized,
consistent with terrain and other factors. Atria between underpass bridge
spans contribute to openness, especially for longer underpasses.
The research team recommends that ADOT investigate and consider other
accepted and cost-effective passage structure designs (e.g., large metal multi-
plate arched culverts). This can be done in an appropriate mix with large,
open-span bridges to reduce cost while promoting permeability.
The researchers recommend that the bridges be placed straight rather than
skewed to maximize animal visibility through the structures. Offset bridges
should be avoided; where offset bridges are necessary, the use of fill material
that limits animal visibility should be minimized.
To date, no structure designed specifically to accommodate pronghorn passage has
been constructed in North America. As such, limited guidelines or insights exist as to
what types of structures are best suited to promoting pronghorn permeability. The
research team believes that overpasses and large elevated viaducts have the best
potential for promoting permeability. Site-specific characteristics associated with
passage structure locations will dictate what type of pronghorn passage structure (e.g.,
underpass, viaduct, overpass) might be appropriate from engineering and cost
standpoints. However, structural design characteristics will have a significant bearing
on the eventual use and acceptance of the passage structures.
The most important structural consideration for pronghorn is the requirement
that the structure be as open and wide as possible, with attention paid to
avoiding obstructed line-of-sight views through or across structures or any
restrictions to mobility.
7.4.1 Role of Passage Structure Spacing
The 11 structures recommended by the research team are spaced from 1.5 to 2.3 miles
apart, with this spacing generally consistent with guidelines for elk and pronghorn
(Bissonette and Adair 2008). The spacing for mule deer exceeds these guidelines,
though deer along SR 64 exhibited home ranges considerably larger than those used
to develop spacing guidelines by Bissonette and Adair (2008).
7.4.2 Role of Fencing
In addition to playing an instrumental role in promoting permeability and highway
safety from reduced WVCs, ungulate-proof fencing has been shown to be crucial to
achieving underpass effectiveness. Without fencing, elk and deer continued to cross
88
SR 260 at a grade adjacent to underpasses (Dodd et al. “Evaluation of Measures,”
2007). With fencing, elk and deer passage rates and probabilities of successful
crossing through underpasses increased dramatically, while at-grade crossings
decreased.
The research team identified 14.2 miles of the highway corridor where fencing
would be needed to meet WVC reduction and permeability objectives,
differing little from the 2006 Final Wildlife Accident Reduction Study
recommendations (Figures 25 and 26).
Though beneficial in reducing WVCs, maximizing passage structure use by wildlife,
and promoting permeability, fencing nonetheless requires constant maintenance and
attention to maintain its integrity.
Future ungulate-proof (wildlife) fencing along SR 64, integrated with passage
structures, should be checked and maintained to ensure long-term integrity
and continued benefit in promoting highway safety. Adequate funding is
needed for ADOT to effectively maintain fencing and passage structures as
these measures increasingly become par of Arizona’s highways.
Because pronghorn have exhibited limited ability to adapt to fences like other
ungulate species, ROW fences contribute significantly to the highway barrier effect.
Fencing, in conjunction with pronghorn passage structures (e.g., overpasses), may be
more useful in providing a visual cue to a path of least resistance across the highway
barrier, provided no fencing is used at the mouth of the passages.
Where ROW and livestock pasture fencing are needed to preclude livestock
access to SR 64, creative approaches should be used to minimize fencing’s
barrier effect to pronghorn. Near passage structures, fences can be pulled back
from the highway 0.25 to 0.5 miles to separate fencing and highway barriers.
A better approach would be the long-term resting of livestock pastures
adjacent to passage structures with the temporary removal of fencing at the
mouths of passage structures.
7.5 HIGHWAY SAFETY AND WILDLIFE-VEHICLE COLLISIONS
The incidence of WVCs along SR 64 is a growing highway safety issue, with an
increase in WVCs from that reported in ADOT (2006) of 36.7 such incidents per year
to 52.0 per year in this study. The research team recorded 167 WVCs, with elk
accounting for 59 percent and mule deer 35 percent of the WVCs. SR 64 sections on
Kaibab NF lands at the north and south ends of the study area had the highest
incidence of elk and deer collisions.
From 1998 through 2008, 42 percent of all single-vehicle accidents along SR 64
involved wildlife, compared with the national average of just 5 percent. Along the 5
miles at the north end of the study area, wildlife-related accidents accounted for more
than 75 percent of all single-vehicle accidents.
89
No WVCs involving pronghorn were recorded during the study, which is thought to
be due to the barrier effect of SR 64 on pronghorn passage.
Based on recent average cost estimates for wildlife vehicle collisions (Huijser et al.
2007), along with available 2007-2009 collision figures, the research team estimated
the annual cost of SR 64 WVCs to be $612,500 for elk and $162,200 for deer, a
combined annual total of $775,000.
It is anticipated that WVCs will be reduced greatly once passage structures
and wildlife fencing are implemented on SR 64, possibly achieving a similar
95 percent reduction realized in other areas (Gagnon et al. 2010). The cost
benefit to be realized with such potential reductions in WVCs can be an
important factor to support implementing mitigation measures.
7.6 MONITORING
Monitoring of wildlife passage structures and associated fencing is vital to providing
insights and knowledge of their effectiveness in promoting wildlife permeability,
particularly with the limited knowledge existing today for pronghorn.
Once SR 64 passage structures are implemented, funding should be sought to
conduct a thorough evaluation of their utilization by wildlife as well as the
level of their contribution to promoting permeability. Monitoring should be
conducted in a scientifically rigorous manner using a before-after-control
experimental design (Hardy et al. 2003, Roedenbeck et al. 2007, Dodd et al.
“Effectiveness of Wildlife,” in review).
The combined application of phased construction, adaptive management, and
effective monitoring and evaluation of measures to reduce WVCs and promote
permeability along SR 260 were instrumental to jointly achieving transportation and
ecological objectives (Dodd et al. “Effectiveness of Wildlife,” in review).
The research team recommends a phased, adaptive management approach to
highway construction and monitoring when and where possible.
Monitoring wildlife mitigation measures and WVCs yielded significant benefit in
improving the efficacy of these measures.
Consideration should be given to using an effective monitoring system
incorporated and funded as part of construction projects, which would add to
the body of knowledge on wildlife collision mitigation measures and
contribute to the toolbox of potential measures for application on highways
elsewhere.
90
91
REFERENCES
Ager A. A., B. K. Johnson, J. W. Kern, and J. G. Kie. 2003. Daily and seasonal
movements and habitat use by female Rocky Mountain elk and mule deer.
Journal of Mammalogy 84:1076–1088.
Arizona Department of Transportation (ADOT). 2006. Final wildlife accident reduction
study, State Route 64: I-40 to Moqui, Williams–Grand Canyon–Cameron
Highway. Project No. 064 CN 185 H5386 01C. Phoenix: Arizona Department of
Transportation.
Arizona Wildlife Linkages Workgroup. 2006. Arizona’s Wildlife Linkages Assessment.
Phoenix: Arizona Department of Transportation, Natural Resources Management
Section,
Barnum, S. A. 2003. Identifying the best locations to provide safe highway crossing
opportunities for wildlife. In: 2003 Proceedings of the International Conference
on Ecology and Transportation, C. L. Irwin, P. Garrett, and K. P. McDermott,
editors, 246–259. Raleigh: Center for Transportation and the Environment, North
Carolina State University.
Bashore, T. L., W. M. Tzilkowski, and E. D. Bellis. 1985. Analysis of deer-vehicle
collision sites in Pennsylvania. Journal of Wildlife Management 49:769–774
Beier, P. 1995. Dispersal of juvenile cougars in fragmented habitat. Journal of Wildlife
Management 59:228–237.
Biggs, J., S. Sherwood, S. Michalak, L. Hansen, and C. Bare. 2004. Animal-related
vehicle accidents at the Los Alamos National Laboratory, New Mexico. The
Southwestern Naturalist 49:384–394.
Bissonette, J. A., and W. Adair. 2008. Restoring habitat permeability to roaded
landscapes with isometrically-scaled wildlife crossings. Biological Conservation
141:482–488.
Bissonette, J. A., and P. Cramer. 2008. Evaluation of the Use and Effectiveness of
Wildlife Crossings. NCHRP Report 615. Washington, DC: National Cooperative
Research Program, Transportation Research Board.
Bright, J. L., and C. van Riper III. 2000. Pronghorn Home Ranges, Habitat Selection,
and Distribution around Water Sources in Northern Arizona. USGS Forest and
Rangeland Ecosystem Science Center, Colorado Plateau Research Station
Technical Report FRESC/COPL/2000/18. Flagstaff, AZ: U.S. Geological Survey.
Brody, A. J., and M. R. Pelton. 1989. Effects of roads on black bear movements in
western North Carolina. Wildlife Society Bulletin 17:5–10.
92
Brown, D. E., editor. 1994. Biotic Communities: Southwestern United States and
Northwestern Mexico. Salt Lake City: University of Utah Press.
Clevenger A. P., B. Chruszcz, and K. Gunson. 2001. Highway mitigation fencing reduces
wildlife-vehicle collisions. Wildlife Society Bulletin 29:646–653.
Clevenger, A. P., and N. Waltho. 2000. Factors influencing the effectiveness of wildlife
underpasses in Banff National Park, Alberta, Canada. Conservation Biology
14:47–56.
_____. 2003. Long-term, year-round monitoring of wildlife crossing structures and the
importance of temporal and spatial variability in performance studies. In 2003
Proceedings of the International Conference on Ecology and Transportation, C.
L. Irwin, P. Garrett, and K. P. McDermott, editors, 293–302 in Raleigh: Center
for Transportation and the Environment, North Carolina State University.
_____. 2005. Performance indices to identify attributes of highway crossing structures
facilitating movement of large mammals. Biological Conservation 121:453–464.
Clevenger, A. P., J. Wierzchowski, B. Chruszcz, and K. Gunson. 2002. GIS-generated,
expert-based models for identifying wildlife habitat linkages and planning
mitigation passages. Conservation Biology 16:503–514.
Clover, M. R. 1954. A portable deer trap and catch-net. California Fish and Game
40:367–373.
Conover, M. R. 1997. Monetary and intangible valuation of deer in the United States.
Wildlife Society Bulletin 25:298–305.
Conrey, R. C. Y., and L. S. Mills. 2001. Do highways fragment small mammal
populations? In 2001 Proceedings of the International Conference on Ecology
and Transportation, G. Evnik and K. P. McDermott, editors, 448–457 472.
Raleigh: Center for Transportation and the Environment, North Carolina State
University.
Corlatti, L., K. Hackländer, and F. Frey-Roos. 2009. Ability of wildlife overpasses to
provide connectivity and prevent genetic isolation. Conservation Biology 23:548–
556.
Dodd, N. L., and J. W. Gagnon. 2011. Influence of underpasses and traffic on white-
tailed deer highway permeability. Wildlife Society Bulletin 35:270–281.
Dodd, N. L., J. W. Gagnon, S. Boe, A. Manzo, and R. E. Schweinsburg. 2007. Evaluation
of Measures to Minimize Wildlife-Vehicle Collisions and Maintain Permeability
Across Highways—Arizona Route 260. FHWA-AZ-07-540. Phoenix: Arizona
Transportation Research Center, Arizona Department of Transportation.
93
Dodd, N. L., J. W. Gagnon, S. Boe, K. Ogren, and R. E. Schweinsburg. in review.
Wildlife-Vehicle Collision Mitigation for Safer Wildlife Movement across
Highways: Arizona Route 260. . FHWA-AZ-12-603. Phoenix: Research Center,
Arizona Department of Transportation.
Dodd, N. L., J. W. Gagnon, S. Boe, and R. E. Schweinsburg. 2007. Assessment of elk
highway permeability by using Global Positioning System telemetry. Journal of
Wildlife Management 71:1107–1117.
Dodd, N. L., J. W. Gagnon, A. L. Manzo, and R. E. Schweinsburg. 2007. Video
surveillance to assess highway underpass use by elk in Arizona. Journal of
Wildlife Management 71:637–645.
Dodd, N. L., J.W. Gagnon, S. Sprague, S. Boe, and R.E. Schweinsburg. 2011. Assessment
of Pronghorn Movements and Strategies to Promote Highway Permeability: US
Highway 89. FHWA-AZ-10-619. Phoenix: Research Center, Arizona Department
of Transportation.
Dyer, S. J., J. P. O’Neill, S. M. Wasel, and S. Boutin. 2002. Quantifying barrier effects of
roads and seismic lines on movements of female woodland caribou in
northeastern Alberta. Canadian Journal of Zoology 80:839–845.
Epps, C. W., P. J. Palsboll, J. D. Wehausen, G. K. Roderick, R. R. Ramey II, and D. R.
McCullough. 2005. Highways block gene flow and cause rapid decline in genetic
diversity of desert bighorn sheep. Ecology Letters 8:1029–1038.
Falk, N. W., H. B. Graves, and E. D. Bellis. 1978. Highway right-of-way fences as deer
deterrents. Journal of Wildlife Management 42:646–650.
Farrell, J. E., L. R. Irby, and P. T. McGowen. 2002. Strategies for ungulate-vehicle
collision mitigation. Intermountain Journal of Sciences 8:1–18.
Federal Highway Administration (FHWA). 2001. Keeping the Noise Down: Highway
Traffic Noise Barriers. Publication FHWA-EP-01-004; HEPN/2-01(10M)E.
Washington, DC: Federal Highway Administration.
Firchow, K. M., M. R. Vaughan, and W. R. Mytton. 1986. Evaluation of the hand-held
net gun for capturing pronghorns. Journal of Wildlife Management 50:320–322.
Forman, R. T. T. 2000. Estimate of area affected ecologically by the road system in the
United States. Conservation Biology 14:31–35.
Forman, R. T. T., and L. E. Alexander. 1998. Roads and their major ecological effects.
Annual Review of Ecology and Systematics 29:207–231.
94
Forman, R. T. T., D. Sperling, J. A. Bissonette, A. P. Clevenger, C. D. Cutshall, V. H.
Dale, L. Fahrig, R. France, C. R. Goldman, K. Heanue, J. A. Jones, F. J. Swanson,
T. Turrentine, and T. C. Winter. 2003. Road Ecology: Science and Solutions.
Washington, DC: Island Press,
Foster, M. L., and S. R. Humphrey. 1995. Use of highway underpasses by Florida
panthers and other wildlife. Wildlife Society Bulletin 23:95–100.
Gagnon, J. W., N. L. Dodd, K. Ogren, and R. E. Schweinsburg. 2011. Factors associated
with use of wildlife underpasses and importance of long-term monitoring. Journal
of Wildlife Management 75:1477–1487.
Gagnon, J. W., N. L. Dodd, S. Sprague, K. Ogren, and R. E. Schweinsburg. 2010.
Preacher Canyon wildlife fence and crosswalk enhancement project evaluation—
State Route 260. Final project report submitted to Arizona Department of
Transportation. Phoenix: Arizona Game and Fish Department.
Gagnon, J. W., N. L. Dodd, S. Sprague, C. Loberger, S. Boe, and R. E. Schweinsburg. in
review. Elk Movements Associated with a High-Volume Highway: Interstate 17.
FHWA-AZ-12-647. Phoenix: Research Center, Arizona Department of
Transportation.
Gagnon, J. W., T. C. Theimer, N. L. Dodd, A. Manzo, and R. E. Schweinsburg. 2007.
Effects of traffic on elk use of wildlife underpasses in Arizona. Journal of Wildlife
Management 71:2324–2328.
Gagnon, J. W., T. C. Theimer, S. Boe, N. L. Dodd, and R. E. Schweinsburg. 2007.
Traffic volume alters elk distribution and highway crossings in Arizona. Journal
of Wildlife Management 71:2318–2323.
Gavin, S. D., and P. E. Komers. 2006. Do pronghorn (Antilocapra americana) perceive
roads as a predation risk? Canadian Journal of Zoology 84:1775–1780.
Gerlach, G., and K. Musolf. 2000. Fragmentation of landscape as a cause for genetic
subdivision in bank voles. Conservation Biology 14:1066–1074.
Gordon, K. M., and S. H. Anderson. 2003. Mule deer use of underpasses in western and
southeastern Wyoming. In 2003 Proceedings of the International Conference on
Ecology and Transportation, C. L. Irwin, P. Garrett, and K. P. McDermott,
editors, 309–318. Raleigh: Center for Transportation and the Environment, North
Carolina State University.
Gunson K. E., Chruszcz, B., and A. P. Clevenger. 2003. Large animal-vehicle collisions
in the central Canadian Rocky Mountains: Patterns and characteristics. In 2003
Proceedings of the International Conference on Ecology and Transportation, C.
L. Irwin, P. Garrett, and K.P. McDermott, editors, 355-366. Raleigh: Center for
Transportation and the Environment, North Carolina State University.
95
Hacker, D. G. 2002. Pronghorn and a California highway: Potential impacts and
mitigation. In Proceedings of the 20th Biennial Pronghorn Workshop, J. S.
Abegglen and W. S. Fairbanks, editors, 143–152.. Chadron, NE: Nebraska
National Forest, U.S. Forest Service.
Haikonen, H., and H. Summala. 2001. Deer-vehicle crashes, extensive peak at 1 hour
after sunset. American Journal of Preventive Medicine 21:209–213.
Hansen, M., J. Coles, K. A. Thomas, D. Cogan, M. Reid, J. Von Loh, and K. Schulz.
2004. USGS-NPS National Vegetation Mapping Program: Wupatki National
Monument, Arizona, Vegetation Classification and Distribution. Flagstaff, AZ:
U.S. Geological Survey, Southwest Biological Science Center.
Hanski, I., and M. E. Gilpin. 1997. Metapopulation Biology. New York: Academic Press.
Hardy, A., A. P. Clevenger, M. Huijser, and G. Neale. 2003. An overview of methods
and approaches for evaluating the effectiveness of wildlife crossing structures:
Emphasizing the science in applied science. In 2003 Proceedings of the
International Conference on Ecology and Transportation, C. L. Irwin, P. Garrett,
and K. P. McDermott, editors, 319-330. . Raleigh: Center for Transportation and
the Environment, North Carolina State University.
Hart, J. V., C. van Riper III, D. J. Mattson, and T. R. Arundel. 2008. Effects of fenced
transportation corridors on pronghorn movements at Petrified Forest National
Park, Arizona. In The Colorado Plateau III: Integrating Research and Resources
Management for Effective Conservation, C. van Riper, III and M. K. Sogge,
editors, 161–185., Tucson: University of Arizona Press.
Hooge, P. N., and B. Eichenlaub. 1997. Animal movement extension to ArcView version
1.1. Anchorage: Alaska Biological Science Center, U.S. Geological Survey.
Hubbard, M. W., B. J. Danielson, and R. A. Schmitz. 2000. Factors influencing the
location of deer-vehicle accidents in Iowa. Journal of Wildlife Management
64:707–713.
Huijser, M. P., P. McGowen, J. Fuller, A. Hardy, A. Kociolek, A. P. Clevenger, D.
Smith, and R. Ament. 2007. Wildlife-Vehicle Collision Reduction Study. Report to
Congress. Washington, DC: U.S. Department of Transportation, Federal Highway
Administration.
Inbar, M., and R. T. Mayer. 1999. Spatio-temporal trends in armadillo diurnal activity
and road-kills in central Florida. Wildlife Society Bulletin 27:865–872.
Iuell, B., G. J. Bekker, R. Cuperus, J. Dufek, G. Fry, C. Hicks, V. Hlavac, V. B. Keller,
C. Rosell, T. Sangwine, N. Torslov, and B. le Maire Wandall. 2003. Cost 341-
Wildlife and Traffic: A European Handbook for Identifying Conflicts and
Designing Solutions. Luxembourg: Office for Official Publications of the
European Communities.
96
Jaeger, J. A. G., J. Bowman, J. Brennan, L. Fahrig, D. Bert, J. Bouchard, N.
Charbonneau, K. Frank, B. Gruber, K. T. von Toschanowitz. 2005. Predicting
when animal populations are at risk from roads: An interactive model of road
avoidance behavior. Ecological Modelling 185:329–348.
Joyce, T. L., and S. P. Mahoney. 2001. Spatial and temporal distributions of moose-
vehicle collisions in Newfoundland. Wildlife Society Bulletin 29:281–291.
Kaseloo, P. A., and K. O. Tyson. 2004. Synthesis of Noise Effects on Wildlife
Populations. Publication FHWA-HEP-06-016. McLean, VA: Office of Research
and Technology Services, Federal Highway Administration.
Lyon, L. J, and A. G. Christensen. 1992. A Partial Glossary of Elk Management Terms.
General Technical Report INT- 288. Ogden, UT: U.S. Department of Agriculture,
Forest Service, Intermountain Research Station.
Manzo, A. L. 2006. An ecological analysis of environmental parameters influencing
Rocky Mountain elk crossings of an Arizona highway. M.S. thesis, Northern
Arizona University.
McGregor, R., S. Derrane, D. Bender, and L. Fahrig. 2003. The effect of traffic volume
on translocated small mammal movement. In 2003 Proceedings of the
International Conference on Ecology and Transportation, C. L. Irwin, P. Garrett,
and K. P. McDermott, editors, 394–396. Raleigh: Center for Transportation and
the Environment, North Carolina State University.
Mueller, S., and G. Berthoud. 1997. Fauna/Traffic Safety: Manual for Civil Engineers.
Lausanne, Switzerland: LAVOC, Department de Genie Civil, Ecole
Polytechnique Federale de Lausanne.
Ng, S. J., J. W. Dole, R. M. Sauvajot, S. P. D. Riley, and T. J. Valone. 2004. Use of
highway undercrossings by wildlife in southern California. Biological
Conservation 115:499–507.
Noss, R. F., and A. Y. Cooperrider. 1994. Saving Nature’s Legacy. Washington, DC:
Island Press.
Ockenfels, R. A., A. Alexander, C. L. Ticer, and W. K. Carrel. 1994. Home Ranges,
Movement Patterns, and Habitat Selection of Pronghorn in Central Arizona.
Research Branch Technical Report 13. Phoenix: Arizona Game and Fish
Department.
Ockenfels, R. A., W. K. Carrel, and C. van Riper III. 1997. Home ranges and movements
of pronghorn in northern Arizona. In: Proceedings of the Third Biennial
Conference of Research on the Colorado Plateau, C. van Riper III, and E. T.
Deshler, editors, 45–61. NPS Transactions and Proceedings Series
NPS/NRNAU/NRTP-97/12. Washington, D.C.: National Park Service.
97
Olsson, M., 2007. The use of highway crossings to maintain landscape connectivity for
moose and roe deer. Ph.D. dissertation, Karlstad University.
Paquet, P. C., and C. Callaghan. 1996. Effects of linear developments on winter
movements of gray wolves in the Bow River Valley of Banff National Park,
Alberta. In Trends in Addressing Transportation Related Wildlife Mortality:
Proceedings of the Transportation Related Wildlife Mortality Seminar, G. L.
Evink, P. Garrett, D. Zeigler, and J. Berry, editors.. FL-ER-58-96. Tallahassee:
Florida Department of Transportation.
Plumb, R. E., K. M. Gordon, and S. H. Anderson. 2003. Pronghorn use of a wildlife
underpass. Wildlife Society Bulletin 31:1244–1245.
Puglisi, M. J., J. S. Lindzey, and E. D. Bellis. 1974. Factors associated with highway
mortality of white-tailed deer. Journal of Wildlife Management 38:799–807.
Reed, D. F., T. D. Beck, and T. N. Woodard. 1982. Methods of reducing deer-vehicle
accidents: Benefit-cost analysis. Wildlife Society Bulletin 10:349–354.
Reed, D. F., and T. N. Woodard. 1981. Effectiveness of highway lighting in reducing
deer-vehicle accidents. Journal of Wildlife Management 45:721–726.
Reed, D. F., T. N. Woodard, and T. M. Pojar. 1975. Behavioral response of mule deer to
a highway underpass. Journal of Wildlife Management 39:361–367.
Reeve, A. F. 1984. Environmental influences on male pronghorn home range and
pronghorn behavior. Ph.D. dissertation, University of Wyoming.
Riley, S. P. D., J. P. Pollinger, R. M. Sauvajot, E. C. York, C. Bromley, T. K. Fuller, and
R. K. Wayne. 2006. A southern California freeway is a physical and social barrier
to gene flow in carnivores. Molecular Ecology 15:1733–1741.
Roedenbeck, I. A., L. Fahrig, C. S. Findlay, J. E. Houlahan, J. A. G. Jaeger, N. Klar, S.
Kramer-Schadt, and E. A van der Grift. 2007. The Rauischholzhausen agenda for
road ecology. Ecology and Society 12:11.
Romin, L. A., and J. A. Bissonette. 1996. Deer-vehicle collisions: Status of state
monitoring activities and mitigation efforts. Wildlife Society Bulletin 24:276–283.
Rost, G. R., and J. A. Bailey. 1979. Distribution of mule deer and elk in relation to roads.
Journal of Wildlife Management 43:634–641.
Rowland, M. M., M. J. Wisdom, B. K. Johnson, and J. G. Kie. 2000. Elk distribution and
modeling in relation to roads. Journal of Wildlife Management 64:672–684.
98
Ruediger, B. 2002. High, wide, and handsome: Designing more effective wildlife and
fish crossings for roads and highways. In Proceedings of the 2001 International
Conference on Ecology and Transportation, 509-516. Raleigh: Center for
Transportation and the Environment, North Carolina State University,
Sawyer, H., and B. Rudd. 2005. Pronghorn Roadway Crossings: A Review of Available
Information and Potential Options. Cheyenne: Wyoming Game and Fish
Department, Wyoming Department of Transportation; Federal Highway
Administration. , USA.
Schwabe, K. A., and P. W. Schuhmann. 2002. Deer-vehicle collisions and deer value: An
analysis of competing literatures. Wildlife Society Bulletin 30:609–615.
Shannon, C., and W. Weaver. 1949. The Mathematical Theory of Communication.
Urbana: University of Illinois Press.
Sheldon, D. P. 2005. Movement and distribution patterns of pronghorn in relation to
roads and fences in southwestern Wyoming. M.S. thesis, University of Wyoming.
Sielecki, L. E. 2004. WARS 1983–2002: Wildlife Accident Reporting and Mitigation in
British Columbia: Special Annual Report. Victoria: Environmental Management
Section, Ministry of Transportation, , British Columbia, Canada.
Swihart, R. K., and N. A. Slade. 1984. Road crossing in Sigmodon hispidus and Microtus
ochrogaster. Journal of Mammalogy 65:357–360.
Trombulak, S. C., and C. A. Frissell. 2000. Review of ecological effects of roads on
terrestrial and aquatic communities. Conservation Biology 14:18–30.
van Riper, C. III, and R. Ockenfels. 1998. The influence of transportation corridors on
the movement of a pronghorn antelope over a fragmented landscape in northern
Arizona. In 1998 Proceedings of the International Conference on Wildlife
Ecology and Transportation, 241–248.. Tallahassee: Florida Department of
Transportation.
Waller, J. S., and C. Servheen. 2005. Effects of transportation infrastructure on grizzly
bears in northwestern Montana. Journal of Wildlife Management 69:985–1000.
Waller, J. S., C. Servheen, and D. A. Patterson. 2006. Probabilistic measure of road
lethality. In Proceedings of the 2005 International Conference on Ecology and
Transportation, C. L. Irwin, P. Garrett, and K.P. McDermott, editors, 503-508.
Raleigh: Center for Transportation and the Environment, North Carolina State
University.
Ward, A. L 1982. Mule deer behavior in relation to fencing and underpasses on Interstate
80 in Wyoming. Transportation Research Record 859:8–13.
99
Ward, A. L., N. E. Fornwalt, S. E. Henry, and R. A. Hodorff. 1980. Effects of Highway
Operation Practices and Facilities on Elk, Mule Deer, and Pronghorn Antelope.
Final Report No. FHWA-RD-79-143. Washington, DC: Federal Highway
Administration.
White, G. C., and R. A. Garrott. 1990. Analysis of Wildlife Radio-Tracking Data. San
Diego, CA: Academic Press.
Wisdom, M. J. 1998. Assessing life-stage importance and resource selection for
conservation of selected vertebrates. Ph.D. dissertation, University of Idaho.
Wisdom, M. J., N. J. Cimon, B. K. Johnson, E. O. Garton, and J. W. Thomas. 2005.
Spatial partitioning by mule deer and elk in relation to traffic. In The Starkey
Project: A Synthesis of Long-Term Studies of Elk and Mule Deer, M. J. Wisdom,
editor, 53–66.. Reprinted from the 2004 Transactions of the North American
Wildlife and Natural Resources Conference. Lawrence, KS: Alliance
Communications Group.
Witmer, G. W., and D. S. deCalesta. 1985. Effect of forest roads on habitat use by
Roosevelt elk. Northwest Science 59:122–125.
Woods, J. G. 1990. Effectiveness of Fences and Underpasses on the Trans-Canada
Highway and Their Impact on Ungulate Populations Project. Banff, AB: Parks
Service, Environment Canada.
Yoakum, J. D. 2004. Habitat conservation. In: Pronghorn Ecology and Management, B.
O’Gara and J. D. Yoakum, editors, 571–630. Boulder: University Press of
Colorado.
Yoakum, J. D., and B. W. O’Gara. 2000. Pronghorn. In: Ecology and Management of
Large Mammals in North America, S. Demarais and P. R. Krausman, editors,
559-577. Upper Saddle River, NJ: Prentice Hall.

