Urban Institute ▪ 500 L’Enfant Plaza SW ▪ Washington DC 20037 urban.org
Impacts of COVID-19-Era Economic Policies on Consumer
Debt in the United Kingdom
Mingli Zhong
Urban Institute
Breno Braga
Urban Institute
Signe-Mary McKernan
Urban Institute
Mark Hayward
Lowell
Elizabeth Millward
Lowell
Christopher Trepel
Fenway Summer LLC
January 27, 2023
The authors welcome feedback on this working paper. Please send all inquiries to [email protected].
Urban Institute working papers are circulated for discussion and comment. Though they may have been
peer reviewed, they have not been formally edited by the Department of Editorial Services and
Publications. The views expressed are those of the authors and should not be attributed to the Urban
Institute, its trustees, or its funders.
Acknowledgements: This research is a joint project of the Urban Institute and Lowell. Urban and Lowell
researchers collaborated on all stages of the research. In addition, Lowell provided funds and operational
and research data. The Urban Institute is grateful to all its funders, who make it possible for Urban to
advance its mission. The views expressed are those of the authors and should not be attributed to the
Urban Institute, its trustees, or its funders. Funders do not determine research findings or the insights and
recommendations of our experts. Further information on the Urban Institute’s funding principles is
available at urban.org/fundingprinciples. We thank Maddie Pickens, Jen Andre, and Noah Johnson for
excellent technical assistance. We also thank Nathan Blascak, Thea Garon, Cormac O’Dea, Miranda
Santillo, and attendees at the Urban Wealth and Financial Well-being Brown Bag and 2022 APPAM Fall
Conference for helpful comments.
Copyright © January 2023. Zhong, Braga, McKernan, Hayward, Millward, Trepel. All rights reserved.
ii
Abstract
We examine the effects of the expanded Universal Credit and mortgage forbearance on the
financial well-being of United Kingdom (UK) residents during the pandemic. Using anonymized
individual-level consumer financial data on 2 million UK consumers, each with one or more
defaulted accounts accrued before the pandemic, we found that average nonmortgage debt
increased by 17 percent from October 2019 (£5,497) to December 2021 (£6,456). Using a
difference-in-difference approach, we found mixed policy impacts on the debt people carried.
Although the expansion of Universal Credit was intended to help financially vulnerable families,
consumers who were more likely to benefit from the Universal Credit expansion took on 1
percent more total nonmortgage debt after the policy expansion. By contrast, during the period of
mortgage forbearance, mortgage holders accumulated 1 percent less total nonmortgage debt
compared with nonmortgage holders. These results suggest that policies implemented in the UK
to protect financially vulnerable families might have exacerbated prepandemic inequalities.

1
Introduction
Financial vulnerability skyrocketed at the onset of the COVID-19 pandemic, when many people
suddenly found themselves out of work (see, e.g., Braga et al. 2021, 2022). In response, many
governments provided stimulus payments and other relief measures (IMF 2021) to buffer
households and individuals against financial difficulties and stimulate the economy in Asia
(Beirne, Morgan, and Sonobe 2021), the European Union (Almeida et al. 2021), Italy (Core and
De Marco 2021), the UK (Blundell et al. 2022), the United States (Marinescu, Skandalis, and
Zhao 2021; Romer 2021), and a number of low- and middle-income countries (Miguel and
Mobarak 2022).
Recent research shows that economic policies enacted in response to COVID-19
appeared to prevent households from suffering immediate financial catastrophes (Chetty et al.
2022). However, we know little about individuals in financial distress before the pandemic,
mostly due to lack of high-quality data.
1
Studying financially distressed populations is important
for two reasons. First, financially distressed individuals could be more financially vulnerable
than others during the pandemic. Second, they were highly likely to be eligible for social
benefits. Thus, studying this group provides evidence on whether COVID-19-era economic
policies were developed and enacted in ways that ultimately helped individuals in need.
To fill this gap in understanding, we used individual-level administrative data from one
of Europe’s largest credit management service companies to track two million financially
distressed UK consumers. Because major COVID-19-era policies targeting households and
individuals were implemented between March 2020 and October 2021, we studied the time
interval between October 2019 and December 2021 to cover the entire period that policies were
active and compare consumer debt outcomes before and after the policy interventions. During
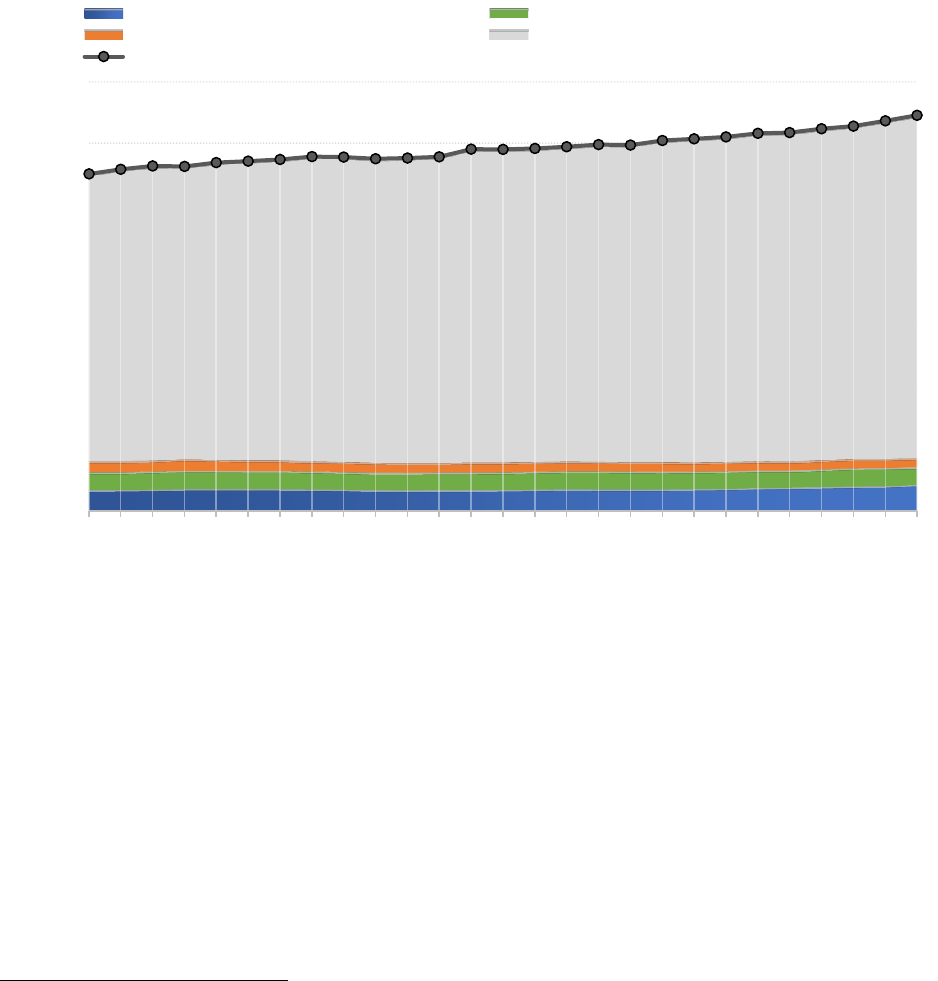
this window, we found that the debt levels of financially distressed individuals steadily increased
in the United Kingdom. The average nonmortgage debt for individuals with defaulted consumer
debt increased by 17 percent from £5,497 in October 2019 to £6,456 in December 2021 (figure
1). Disaggregating monthly nonmortgage debt by types, we found the debt on average consists of
1
In this working paper, individuals with financial distress are defined as those with one or more charged-off and
defaulted accounts accrued before the pandemic.
2
6 percent credit card debt, 5 percent subprime loans, 3 percent checking account overdrafts, and
86 percent other forms of nonmortgage debt not directly observed from the data.
Figure 1. Average Nonmortgage Debt for Individuals with Defaulted Consumer Debt
Increased from October 2019 to December 2021
Source: We used individual-level administrative data from Lowell, one of Europe’s largest credit management
service companies, to track financially distressed consumers in the UK between October 2019 and December 2021.
Notes: The dark gray dotted line is the average nonmortgage balance for individuals in our sample. Debt levels have
steadily increased for individuals with financial distress in the UK. The average nonmortgage debt for individuals
with defaulted consumer debt increased from £5,497 in October 2019 to £6,456 in December 2021. The total
nonmortgage debt consisted of 6 percent credit card debt (blue bars), 5 percent subprime loans (green bars), 3
percent checking account overdrafts (orange bars), and 86 percent other forms of nonmortgage debt that we do not
directly observe from the data (grey bars). N = 1,959,170.
In this working paper, we examine the effects of two COVID-19-era UK economic
policies:
2
expanded Universal Credit and mortgage forbearance.
2
Unlike the US, the UK did not implement student loan forbearance during the pandemic. An overview of the UK
COVID-19-era economic policies can be found here (IMF 2021): https://www.imf.org/en/Topics/imf-and-
covid19/Policy-Responses-to-COVID-19#U. We do not study other policies, such as the Coronavirus Job Retention
Scheme, which transferred money to employers rather than directly to consumers.
5,497
5,576
5,627
5,623
5,682
5,707
5,734
5,782
5,773
5,747
5,757
5,778
5,903
5,898
5,914
5,943
5,976
5,968
6,045
6,071
6,102
6,161
6,172
6,234
6,280
6,364
6,456
0
1000
2000
3000
4000
5000
6000
7000
OCT-19
NOV-19
DEC-19
JAN-20
FEB-20
MAR
-20
APR-20
MAY
-20
JUN-20
JUL-20
AUG-20
SEP-20
OCT-20
NOV-20
DEC-20
JAN-21
FEB-21
MAR
-21
APR-21
MAY
-21
JUN-21
JUL-21
AUG-21
SEP-21
OCT-21
NOV-21
DEC-21
Average Monthly Balance (£)
Credit cards Subprime loans
Checking account overdraft Other non-mortgage debts
Total non-mortgage debts

3
Universal Credit expansion:
3
From March 2020 through October 2021, in addition to the
standard Universal Credit payment, each eligible UK household received an additional £20 per
week. This increase was applied uniformly across the UK.
4
Mortgage forbearance: Homeowners with mortgages in the UK were able to request
mortgage forbearance from March 2020 through March 2021.
5
Once mortgage forbearance was
granted, mortgage holders were allowed to defer full or partial mortgage payments by up to six
months if they experienced difficulties making payments during the pandemic. Mortgage holders
were eligible to claim mortgage forbearance even if they were in payment shortfall or already
benefiting from an alternative forbearance program. The policy was applied uniformly across the
UK.
6
We used difference-in-difference models to describe the impacts of COVID-19-era
economic policies on consumer debt outcomes and constructed a treatment group (individuals
likely to benefit from the policy) and comparison group (individuals unlikely to benefit but
descriptively similar to those in the treatment group). To find a suitable comparison group, we
used propensity score matching to pair individuals in the treatment group with those with similar
baseline characteristics in the comparison group. We then tracked the two groups before and
after each policy was implemented.
Overall, the results are mixed. We found no evidence that the £20 per week additional
Universal Credit policy reduced nonmortgage debt reliance among consumers more likely to
benefit from the policy. Although the Universal Credit expansion was intended to help
3
Universal Credit in the UK is similar to unemployment insurance in the US. Workers who have low incomes or are
unemployed are eligible for Universal Credit and its expansion.
4
For more details about the changes in the Universal Credit payments during COVID-19, see Hobson (2021):
https://researchbriefings.files.parliament.uk/documents/CBP-8973/CBP-8973.pdf. The Working Tax Credit (WTC)
was also increased by £20 per week and claimants received a one-off payment of £500 in April 2021. The Local
Housing Allowance (LHA) was increased to the 30th percentile of local rents (it had previously been frozen for four
years and fell below most rents).
5
Mortgage forbearance was not automatically applied; eligible mortgage holders needed to apply. For additional
details about mortgage forbearance, see Cromarty, Wilson, and Barton (2021):
https://commonslibrary.parliament.uk/research-
briefings/sn04769/#:~:text=Coronavirus%20(Covid%2D19)%3A%20mortgage%20support%20measures&text=A%
20moratorium%20on%20possession%20proceedings,2020%20to%201%20April%202021.
6
Deferrals were available through July 31, 2021, but the last date to apply for a new deferral was March 31, 2021
(to get a full six months of deferrals, borrowers were required to apply in February and could defer through July 31).
Those already in forbearance could extend after March 31 through July 31, 2021, but the extended deferral payments
had to be consecutive. Source: Financial Conduct Authority (2020): https://www.fca.org.uk/publication/finalised-
guidance/mortgages-coronavirus-payment-deferral-guidance.pdf.
4
financially vulnerable families, residents living in areas with a high share of Universal Credit
beneficiaries took on 1 percent more nonmortgage debt than residents living in areas with a low
share of beneficiaries. On the other hand, we found that mortgage holders benefited from
mortgage forbearance by accumulating less nonmortgage debt. In precise terms, during the
period of mortgage forbearance, mortgage holders accumulated 1 percent less nonmortgage debt
than nonmortgage holders.
These two results combined suggest that policies implemented in the UK to protect
families might have exacerbated prepandemic inequalities. The Universal Credit is a means-
tested program aimed at vulnerable populations, such as those out of work or disabled. Our
findings suggest that the small (£20 per week) payment Universal Credit increments were
insufficient to prevent beneficiaries from accumulating additional debt during the pandemic. On
the other hand, mortgage forbearance benefits homeowners who tend to be more financially
secure. Our results suggest that mortgage holders used the extra resources to pay down their
nonmortgage debt.
Our findings contribute to the literature across three dimensions. First, our research
speaks to an important policy debate about the design and delivery of cash transfers and
mortgage forbearance to families with low incomes, existing debt relief evidence (Cherry et al.
2021), and expanded child tax credits (Pilkauskas et al. 2022). In studying the US response to the
2007–09 Great Recession, Schanzenbach and colleagues (2016) concluded that the most
stimulative fiscal spending types are (1) programs directed at people with low incomes or who
are newly unemployed, followed by (2) tax cuts focused on people with lower incomes because
people with lower incomes are more likely than people with higher incomes to spend what they
receive. We found supportive evidence that, when debt relief is large enough, consumers spend
more on credit cards and pay down high-cost loans (such as subprime loans).
Second, while many studies focus on the US (Federal Reserve Board 2020; Han, Meyer,
and Sullivan 2020; New York Fed 2021), we provide additional evidence from the UK to
identify policies that are universally effective at alleviating the adverse economic effects on
households and individuals during significant economic shocks. Previous UK studies document
increases in poverty (Legatum Institute 2020) and unemployment (ONS 2020) during the first
year of the pandemic. Using scanner data, O’Connell, De Paula, and Smith (2021) found large
increases in demand for storable products in the days before the first UK lockdown in March

5
2020, with the largest demand spikes for wealthier households. Based on these previous UK
studies documenting the macroeconomic conditions and household spending behavior, little is
known about whether pandemic-era economic policies helped alleviate financial distress. Our
research complements previous research by identifying policy impacts using administrative
credit data that covers the whole time frame when major policies were enacted. Lastly, our focus
on financially distressed populations sheds light on the question of whether stimulus and relief
programs are well-targeted to those in greatest need (Braga et al. 2019; Braga, Mckernan, and
Hassani 2019).
Data and Methods
Our analyses combined anonymized, individual-level, monthly financial data from Lowell, one
of Europe’s largest credit management service companies, with socioeconomic data from the
Offices for National Statistics (ONS). The Lowell data are generally representative of financially
vulnerable consumers in the UK. Braga and colleagues (2021) compared the share of adults who
are Lowell consumers in default with the share of consumers from one of the UK’s major credit
reference agencies whose credit record contains a defaulted debt in the same geographic area and
found a very strong (0.97) correlation.
We tracked approximately two million Lowell consumers monthly between October 2019
and December 2021. The data included information on credit balances, mortgage balances, and
nonmortgage balances. All individuals had an active account from October 2019 through
December 2021 and/or an account that was closed up to two years before October 2019. Lowell
consumers are typically in financial distress, having defaulted on at least one unsecured credit
account (and often more than one).
7
Lowell has detailed credit records for each consumer from two major credit reference
agencies, including data on the balances of all debt types (including subprime loans) and credit
use. Basic socioeconomic characteristics are also available, such as age, gender, and location
data. The Office for National Statistics (ONS) provides data on race, ethnicity, and income at the
7
In the Lowell data, we do not know when consumers entered default.

6
district level, as well as the share of Universal Credit beneficiaries at the ward level; we merged
the ONS and Lowell data at their respective geographic levels.
8
The two policies of interest, mortgage forbearance and Universal Credit, both started in
March 2020. In February 2020, the average nonmortgage debt load (our primary outcome) in our
sample was £5,682, the share of Lowell customers with mortgages was 7.5 percent, and the
average mortgage balance for mortgage holders was £8,161 (table 1). These credit balances
come from the Lowell data and were reported before any pandemic-related policies came into
effect. The median percent of Universal Credit beneficiaries by ward was 3.7 percent (table 1),
based on data from the ONS. To estimate the likelihood that an individual received the Universal
Credit, we used the percentage of Universal Credit beneficiaries in each ward. In other words,
the higher the share of Universal Credit beneficiaries within a ward, the more likely a given
individual living in that area received base Universal Credit benefits and the expansion. Table 1
also presents sample demographic characteristics used as control variables in our analyses: 48
percent female and median age 40 (from the Lowell data) and 8.1 percent median people color
by ward. To understand the racial and ethnic makeup of the local area of each individual in our
sample, we used ONS data describing the percentage of people of color in their home ward.
Table 1. Summary Statistics of a Sample Representative of the Financially Distressed
Population in the UK in February 2020
Variables
Summary Statistics (February 2020)
Panel A: Data from Lowell
Percent female
48.0%
Median age
40
Percent mortgage holders
7.5%
Average mortgage balance
£8,161
Average nonmortgage balance
£5,682
Panel B: Data from the Office for National Statistics
Median percentage people of color, by ward
8.1%
Median share of Universal Credit beneficiaries, by ward
3.7%
Number of unique consumers
1,959,170
8
Districts and wards are geographic units in the UK, and wards are more granular than districts—see Office for
National Statistics (2021):
https://www.ons.gov.uk/methodology/geography/ukgeographies/administrativegeography/england#metropolitan-
counties-and-districts.
7
Source: Summary statistics of the full sample in February 2020 based on individual-level administrative data from
Lowell, one of Europe’s largest credit management service companies.
Notes: Panel A shows gender, age, percent of mortgage holders, and average nonmortgage balance from the Lowell
data in February 2020. Panel B shows additional statistics from the Office for National Statistics (ONS). We provide
additional race and ethnicity data at the ward level for the sample, where wards are the most granular geographic
levels standardized across the UK (see ONS 2021). We also show the median share of Universal Credit beneficiaries
by ward. All statistics are prepandemic. See page 11 in Breno and colleagues (2021) comparing a similar sample to
the UK general population in financial distress. Our sample is representative of the UK population in financial
distress. N = 1,959,170.
We relied on a difference-in-difference research design. We compared the debt outcomes
of the matched treatment and comparison groups before and after the policy implementation. The
underlying assumption was that the treatment and comparison groups would have parallel
outcome trajectories in the absence of the policy. We used propensity score matching to find a
group who looked like those affected by the policy before the pandemic and thereby constructed
a comparison group. Specifically, the propensity score matching process used debt status from
before the pandemic to identify similar individuals across the treatment and comparison groups.
We found that prepandemic debt markers are strong predictors for estimating debt status during
the pandemic. This means that, without policy interventions, individuals in the treatment and
matched comparison groups would follow similar personal debt trajectories. Therefore, the
observed differences in debt trajectories between the two groups helped us causally identify the
impacts of policy interventions on consumer debt levels.
To further control for confounding factors that could drive debt outcomes differentially
between the treatment and comparison groups, we controlled for gender, age, race, ethnicity, time
fixed effects, and geographic fixed effects in our regression analyses. We also controlled for other
policies implemented concurrently with the policy of interest to distinguish the impact of each.
Universal Credit Expansion
The comparison and treatment groups that we created to empirically identify the impact of
Universal Credit expansion share similar socioeconomic characteristics and debt outcomes (table
2). We defined our treatment group as individuals living in wards with a share of Universal
Credit beneficiaries above the median (i.e., 3.7 percent, as shown in table 1). The comparison
group is defined as individuals living in wards with a share of Universal Credit beneficiaries
below the median.

8
Table 2. Socioeconomic Characteristics Are Similar between Individuals Living in Wards
with a Share of Universal Credit Beneficiaries above Median and Those Living in Wards
with a Share of Universal Credit Beneficiaries below Median.
Variables
Summary Statistics in February 2020
Individuals living in
wards with a share of
Universal Credit
Matched individuals
living in wards with a
share of Universal Credit
Individuals living in wards
with a share of Universal
Credit beneficiaries
beneficiaries above
median
beneficiaries below
median
below median
Panel A: Data from Lowell
Percent female
47.9%
48.5%
48.7%
Median age
40
41
41
Percent mortgage
holders
7.0%
8.8%
9.6%
Average mortgage
balance
£6,840
£12,314
£13,748
Average nonmortgage
balance
£5,455
£5,480
£6,652
Panel B: Data from the Office for National Statistics
Median percent of
people of color by ward
10.9%
4.0%
3.9%
Median share of
Universal Credit
beneficiaries by ward
4.2%
1.5%
1.5%
Number of unique
consumers
1,580,609
329,343
376,741
Source: We used individual-level administrative data from Lowell, one of Europe’s largest credit management
service companies, to track financially distressed consumers in the UK between October 2019 and December 2021.
Notes: Summary statistics for the two groups presented in Figure 2: Lowell consumers living in wards with a share
of Universal Credit beneficiaries below (and including) the median and those living in wards with a share of
beneficiaries above median. The median share of Universal Credit beneficiaries was 3.7 percent (as shown in table
1). To match individuals in the treatment group with individuals in the control group, we used propensity score
matching using three prepandemic debt outcomes as covariates: nonmortgage debt in February 2020, December
2019, and October 2019. Comparing Columns (2) and (3), socioeconomic characteristics including the share of
female, median age, and percent of mortgage holders between the two groups are close. Average nonmortgage
balance was also close because we used this nonmortgage debt to match individuals between the two groups. People
living in low-share areas had a higher average mortgage balance, likely because their home values were higher.
They were also more likely to live in areas with a low share of people of color. Column (4) presents summary
statistics unweighted by propensity scores for individuals living in wards with a share of Universal Credit
beneficiaries below the median. The number of unique consumers in Columns (3) is slightly less than in Column (4)
because some individuals in Column (3) were not matched with anyone in Column (2) during the propensity score
matching process. Although some people were not matched, the socioeconomic characteristics were similar to those
shown in Columns (3) and (4).
In table 2, Columns (2) and (3) show summary statistics for the treatment and matched
comparison groups. Column (4) presents summary statistics for the unmatched comparison
group. The number of unique consumers in Columns (3) is slightly smaller than in Column (4) as

9
some individuals’ characteristics prevented matching with anyone in the treatment group.
Although some people in the comparison group were not matched, socioeconomic characteristics
before and after the matching were similar to those shown in Columns (3) and (4). To match
individuals in the treatment group with individuals in the comparison group with similar
characteristics, we used three prepandemic nonmortgage debt outcomes measured in February
2020, December 2019, and October 2019. The underlying assumption was that without Universal
Credit expansion, matched individuals in these two groups would have parallel debt trajectories
from March 2020 onward.
However, individuals who were more likely to receive the Universal Credit expansion
accumulated more nonmortgage debt than those who were less likely to receive it (figure 2).
Regression results further quantify the differences in debt accumulation: during the period that
Universal Credit was expanded by £20 per week, UK residents living in areas with a high share
of Universal Credit beneficiaries accumulated about 1 percent more nonmortgage debt than those
living in areas with a low share of Universal Credit beneficiaries (table 3). The results are
statistically significant, robust across difference specifications, and based on difference-in-
difference regression results that quantify the causal impact of the expanded Universal Credit.
All regression specifications used the same matched individuals as described in figure 2.
Figure 2. Residents Living in Areas with a High Share of Universal Credit Beneficiaries
Took on More Nonmortgage Debt Than Those Living in Areas with a Low Share of
Beneficiaries during the Universal Credit Expansion.
2,800
2,900
3,000
3,100
3,200
3,300
3,400
3,500
3,600
Oct-19
Nov-19
Dec-19
Jan-20
Feb-20
Mar-20
Apr-20
May-20
Jun-20
Jul-20
Aug-20
Sep-20
Oct-20
Nov-20
Dec-20
Jan-21
Feb-21
Mar-21
Apr-21
May-21
Jun-21
Jul-21
Aug-21
Sep-21
Oct-21
Nov-21
Dec-21
Average Monthly Nonmortgage
Balance (£)
UC low share UC high share
March-20: Universal Credit
expansion start
Oct-21: Universal Credit
expansion end
10
Source: We used individual-level administrative data from Lowell, one of Europe’s largest credit management
service companies, to track financially distressed consumers in the UK between October 2019 and December 2021.
Notes: Average nonmortgage balance for individuals living in wards with a share of Universal Credit beneficiaries
below median (blue line) compared with those living in wards with a share of Universal Credit beneficiaries above
median (red line) from October 2019 through December 2021. After the Universal Credit expansion was
implemented (from March 2020 through October 2021), residents living in high-share wards took on more
nonmortgage debt than those living in low-share wards. To match individuals in the treatment group with
individuals in the control group, we used propensity score matching using three prepandemic debt outcomes:
nonmortgage debt in February 2020, December 2019, and October 2019. Number of unique consumers in the red
line (living in areas where the share of Universal Credit beneficiaries was above the median) = 1,580,609. Number
of unique consumers in the blue line (living in areas where the share of Universal Credit beneficiaries was below the
median) = 329,343. See table 2 for more summary statistics. See table 3 for regression results that quantify the
differences in nonmortgage debt.

11
Table 3. Residents Living in Areas with a High Share of Universal Credit Beneficiaries
Took on 1 Percent More Nonmortgage Debt Than Those Living in Areas with a Low Share
of Beneficiaries during the Universal Credit Expansion.
Outcome: Log of Nonmortgage Balances
(1)
(2)
(3)
(4)
During Universal Credit
(UC) expansion
0.175***
0.162***
-0.0198
-0.0204
(0.001)
(0.001)
(6.937)
(6.912)
UC share above median
0.00389***
0.0833***
0.0561***
0.0655***
(0.001)
(0.001)
(0.001)
(0.001)
UC expansion X UC share
above median
0.00896***
0.00910***
0.00944***
0.00998***
(0.001)
(0.001)
(0.001)
(0.001)
Female
0.0850***
0.0807***
0.0828***
(0.000)
(0.000)
(0.000)
Age
0.00471***
0.00452***
0.00290***
(0.000)
(0.000)
(0.000)
Percent of people of color
by ward
-0.00661***
-0.00495***
-0.00480***
(0.000)
(0.000)
(0.000)
Mortgage holders in
February 2020
0.377***
(0.001)
Month fixed effects
x
x
x
x
Parliamentary constituency
fixed effects
x
x
N
51,029,729
50,742,539
50,282,178
50,282,178
Mean dependent:
8.052
8.057
8.057
8.057
R2
0.00184
0.0151
0.0261
0.0330
Source: We used individual-level administrative data from Lowell, one of Europe’s largest credit management
service companies, to track financially distressed consumers in the UK between October 2019 and December 2021.
Notes: Regression results from difference-in-difference models to quantify the impact of Universal Credit expansion
(March 2020–October 2021) on nonmortgage debt. The outcome variable is the log of nonmortgage balances from
October 2019 to December 2021. The comparison group is defined based on propensity score matching on three
prepandemic characteristics: nonmortgage debt in February 2020, December 2019, and October 2019 (same as in
figure 2). Specification (1) is the baseline regression model with three covariates: the time dummy variable
indicating whether the individual was observed during the period that the Universal Credit was expanded, a dummy
variable indicating whether the individual lived in an area where the share of Universal Credit beneficiaries was
above the median in February 2020, and the interaction of the two dummy variables. In specification (2), we add
socioeconomic characteristics including gender, age, and race and ethnicity. Because we did not have the individual-
level racial and ethnic information, we used the percent of people of color by ward, which was the most granular
geographic area with race data available. We added month-time fixed effects to all the specifications. In
specification (3), we added another geographic fixed effect, parliamentary constituency specifically, to further
control for underlying variations across location. In specification (4), we added another control—an indicator of
mortgage holders in February 2020. This indicator approximates the likelihood that the given individual would be
eligible and apply for mortgage forbearance. Because the period of mortgage forbearance from March 2020 through
March 2021 overlapped with the Universal Credit expansion, we controlled for the potential impact of mortgage
forbearance to have a cleaner identification for the impact of the expansion.

12
Specification (1) is the baseline regression model with three covariates: the time dummy
variable indicating whether the individual was observed during the Universal Credit expansion
period (i.e., March 2020–October 2021), a dummy variable indicating whether the individual
lived in an area where the share of Universal Credit beneficiaries was above the median in
February 2020,
9
and the interaction of the two dummy variables. In specification (2), we added
socioeconomic characteristics, including gender, age, and race and ethnicity. Because we did not
have individual-level racial and ethnic information, we used the percentage of people of color by
ward, which provided the most granular geographic data available. In specification (3), we added
another geographic fixed effect, parliamentary constituency, to further control for underlying
variations across location. In specification (4), we added another control—an indicator for
mortgage holders in February 2020. This indicator approximates the likelihood that the given
individual would be eligible, and apply, for mortgage forbearance. Because the period of
mortgage forbearance from March 2020 through March 2021 overlapped with the Universal
Credit expansion, we controlled for the potential impact of mortgage forbearance to better
identify the expansion’s impact. We discuss more results about mortgage forbearance in the next
section, adding month-time fixed effects to all the specifications.
In addition to the overall increase in nonmortgage debt for people who were likely to
receive Universal Credit, we also found shifts in specific debt types. During the period when
Universal Credit was expanded, residents living in areas with a high share of Universal Credit
beneficiaries took on 2 percent less credit card debt, no significant increase in subprime loan
balances, and 1 percent less in the amounts overdrafted from their checking accounts compared
with those living in areas with a low share of beneficiaries (figures 3–5 and tables 4–6). For each
debt type, we matched individuals using debt-specific prepandemic levels. For example, we used
three prepandemic credit card debts (February 2020, December 2019, and October 2019) to find
appropriate consumers in the comparison group.
9
We used the prepandemic share of Universal Credit beneficiaries to avoid endogeneity between the covariates and
the outcomes. For example, the decision of claiming Universal Credit might be affected by the expansion. Using the
share of Universal Credit beneficiaries in February 2020 provides the relative differences in benefit concentration
across regions without being endogenous with our outcomes.

13
Figure 3. Residents Living in Areas with a High Share of Universal Credit Beneficiaries
Took on Less Credit Card Debt Than Those Living in Areas with a Low Share of
Beneficiaries during the Universal Credit Expansion.
Source: We used individual-level administrative data from Lowell, one of Europe’s largest credit management
service companies, to track financially distressed consumers in the UK between October 2019 and December 2021.
Notes: Average credit card balance for individuals living in wards with a share of Universal Credit beneficiaries
below median (blue line) compared with those living in wards with a share of Universal Credit beneficiaries above
median (red line) from October 2019 through December 2021. To match individuals in the treatment group with
individuals in the control group, we used propensity score matching using three prepandemic debt outcomes: credit
card debt in February 2020, December 2019, and October 2019. See table 4 for regression results that quantify the
differences in credit card debt.
700
750
800
850
900
950
1,000
1,050
Oct-19
Nov-19
Dec-19
Jan-20
Feb-20
Mar-20
Apr-20
May-20
Jun-20
Jul-20
Aug-20
Sep-20
Oct-20
Nov-20
Dec-20
Jan-21
Feb-21
Mar-21
Apr-21
May-21
Jun-21
Jul-21
Aug-21
Sep-21
Oct-21
Nov-21
Dec-21
Average Monthly Credit Card Balance (£)
UC low share UC high share
March-20: Universal Credit
expansion start
Oct-21: Universal Credit
expansion end

14
Figure 4. Residents Living in Areas with a High Share of Universal Credit Beneficiaries
Followed Similar Subprime Loan Balance Trajectories, Compared with Those Living in
Areas with a Low Share of Beneficiaries, during the Universal Credit Expansion.
Source: We used individual-level administrative data from Lowell, one of Europe’s largest credit management
service companies, to track financially distressed consumers in the UK between October 2019 and December 2021.
Notes: Average subprime loan balances for individuals living in wards with a share of Universal Credit beneficiaries
below median (blue line) compared with those living in wards with a share of Universal Credit beneficiaries above
median (red line) from October 2019 through December 2021. To match individuals in the treatment group with
individuals in the control group, we used propensity score matching using three prepandemic debt outcomes:
subprime loans in February 2020, December 2019, and October 2019. Although the two lines in this figure reveal
differences from August 2020 through May 2021, those differences were absorbed by socioeconomic characteristics,
the location fixed effect, and the time fixed effect in table 5. See table 5 for regression results showing that subprime
loan trajectories were not significantly different between these two groups.
580
600
620
640
660
680
700
Oct-19
Nov-19
Dec-19
Jan-20
Feb-20
Mar-20
Apr-20
May-20
Jun-20
Jul-20
Aug-20
Sep-20
Oct-20
Nov-20
Dec-20
Jan-21
Feb-21
Mar-21
Apr-21
May-21
Jun-21
Jul-21
Aug-21
Sep-21
Oct-21
Nov-21
Dec-21
Average Monthly Subprime Loan
Balances (£)
UC low share UC high share
March-20: Universal Credit
expansion start
Oct-21: Universal Credit
expansion end

15
Figure 5. Residents Living in Areas with a High Share of Universal Credit Beneficiaries
Carried Less in Checking Account Overdraft Amounts Than Those Living in Areas with a
Low Share of Beneficiaries during the Universal Credit Expansion.
Source: We used individual-level administrative data from Lowell, one of Europe’s largest credit management
service companies, to track financially distressed consumers in the UK between October 2019 and December 2021.
Notes: Average checking account overdraft amounts for individuals living in wards with a share of Universal Credit
beneficiaries below median (blue line) compared with those living in wards with a share of Universal Credit
beneficiaries above median (red line) from October 2019 through December 2021. To match individuals in the
treatment group with individuals in the control group, we used propensity score matching using three prepandemic
debt outcomes: checking account overdraft amounts in February 2020, December 2019, and October 2019. While
the two lines in this figure show similar checking account overdraft levels for the two groups during the Universal
Credit expansion, the red group (UC high share) accumulated less in checking account overdraft amounts after
controlling for socioeconomic characteristics, the location fixed effect, and the time fixed effect in table 6. See table
5 for regression results showing that checking account overdraft levels were significantly different between these
two groups.
165
170
175
180
185
190
195
200
205
210
215
Oct-19
Nov-19
Dec-19
Jan-20
Feb-20
Mar-20
Apr-20
May-20
Jun-20
Jul-20
Aug-20
Sep-20
Oct-20
Nov-20
Dec-20
Jan-21
Feb-21
Mar-21
Apr-21
May-21
Jun-21
Jul-21
Aug-21
Sep-21
Oct-21
Nov-21
Dec-21
Average Monthly Checking Account
Overdraft (£)
UC low share UC high share
March-20: Universal Credit
expansion start
Oct-21: Universal Credit
expansion end

16
Table 4. Residents Living in Areas with a High Share of Universal Credit Beneficiaries
Took on 2 Percent Less Credit Card Debt Than Those Living in Areas with a Low Share of
Beneficiaries during the Universal Credit Expansion.
Outcome: Log of Credit Card Balances
(1)
(2)
(3)
(4)
During Universal Credit
(UC) expansion
0.256***
0.213***
0.213***
0.214***
(0.003)
(0.003)
(0.003)
(0.003)
UC share above median
-0.00641***
0.00389*
0.0273***
0.0386***
(0.002)
(0.002)
(0.002)
(0.002)
UC expansion X UC share
above median
-0.0235***
-0.0214***
-0.0211***
-0.0207***
(0.002)
(0.002)
(0.002)
(0.002)
Female
-0.108***
-0.108***
-0.101***
(0.001)
(0.001)
(0.001)
Age
0.0169***
0.0168***
0.0145***
(0.000)
(0.000)
(0.000)
Percent of people of color by
ward
0.000830***
-0.00191***
-0.00171***
(0.000)
(0.000)
(0.000)
Mortgage holders in February
2020
0.434***
(0.001)
Month fixed effects
x
x
x
x
Parliamentary constituency
fixed effects
x
x
N
8,847,719
8,797,326
8,722,622
8,722,622
Mean dependent:
6.733
6.731
6.731
6.731
R2
0.00194
0.0270
0.0318
0.0458
Source: We used individual-level administrative data from Lowell, one of Europe’s largest credit management
service companies, to track financially distressed consumers in the UK between October 2019 and December 2021.
Notes: Regression results from difference-in-difference models to quantify the impact of Universal Credit expansion
(March 2020–October 2021) on credit card debt. The outcome variable is the log of credit card balances from
October 2019 to December 2021. The comparison group is defined based on propensity score matching on three
prepandemic characteristics: credit card debt outcomes in February 2020, December 2019, and October 2019 (same
as in figure 3). All specifications are identical to those in table 3.

17
Table 5. Residents Living in Areas with a High Share of Universal Credit Beneficiaries
Took on Similar Levels of Subprime Loan Balances as Those Living in Areas with a Low
Share of Beneficiaries during the Universal Credit Expansion.
Outcome: Log of Subprime Loan Balances
(1)
(2)
(3)
(4)
During Universal Credit
(UC) expansion
0.0534***
0.00624**
0.00301
0.00314
(0.002)
(0.002)
(0.002)
(0.002)
UC share above median
-0.00476***
0.00128
0.01000***
0.0102***
(0.001)
(0.001)
(0.001)
(0.001)
UC expansion X UC share
above median
-0.00855***
0.000937
0.000776
0.000799
(0.002)
(0.002)
(0.002)
(0.002)
Female
0.0984***
0.0879***
0.0880***
(0.001)
(0.001)
(0.001)
Age
0.0200***
0.0189***
0.0189***
(0.000)
(0.000)
(0.000)
Percent of people of color
by ward
-0.00106***
-0.000510***
-0.000505***
(0.000)
(0.000)
(0.000)
Mortgage holders in
February 2020
0.0280***
(0.002)
Month fixed effects
x
x
x
x
Parliamentary constituency
fixed effects
x
x
N
12,165,031
12,131,928
12,013,280
12,013,280
Mean dependent:
6.474
6.475
6.476
6.476
R2
0.000216
0.0441
0.0728
0.0728
Source: We used individual-level administrative data from Lowell, one of Europe’s largest credit management
service companies, to track financially distressed consumers in the UK between October 2019 and December 2021.
Notes: Regression results from difference-in-difference models to quantify the impact of Universal Credit expansion
(March 2020–October 2021) on subprime loans. The outcome variable is the log of subprime loan balances from
October 2019 to December 2021. The comparison group is defined based on propensity score matching on three
prepandemic characteristics: subprime loan balances in February 2020, December 2019, and October 2019 (same as
in figure 4). All specifications are identical to those in table 3.

18
Table 6. Residents Living in Areas with a High Share of Universal Credit Beneficiaries
Took on 1 Percent Less in Checking Account Overdraft Amounts Than Those Living in
Areas with a Low Share of Beneficiaries during the Universal Credit Expansion.
Outcome: Log of Checking Account Overdraft Amounts
(1)
(2)
(3)
(4)
During Universal Credit
(UC) expansion
0.0942***
0.0441***
0.0738***
0.0794***
(0.006)
(0.006)
(0.005)
(0.005)
UC share above median
0.00838**
0.0735***
-0.130***
-0.104***
(0.003)
(0.003)
(0.003)
(0.003)
UC expansion X UC share
above median
0.00303
0.00693*
-0.0174***
-0.0139***
(0.003)
(0.003)
(0.003)
(0.003)
Female
0.195***
0.137***
0.131***
(0.001)
(0.001)
(0.001)
Age
0.0207***
0.0224***
0.0166***
(0.000)
(0.000)
(0.000)
Percent of people of color
by ward
-0.00482***
-0.00563***
-0.00520***
(0.000)
(0.000)
(0.000)
Mortgage holders in
February 2020
1.011***
(0.003)
Month fixed effects
x
x
x
x
Parliamentary constituency
fixed effects
x
x
N
5,990,424
5,959,751
5,900,122
5,900,122
Mean dependent:
5.284
5.283
5.283
5.283
R2
0.000404
0.0230
0.126
0.149
Source: We used individual-level administrative data from Lowell, one of Europe’s largest credit management
service companies, to track financially distressed consumers in the UK between October 2019 and December 2021.
Notes: Regression results from difference-in-difference models to quantify the impact of Universal Credit expansion
(March 2020–October 2021) on checking account overdraft amounts. The outcome variable is the log of checking
account overdraft amounts from October 2019 to December 2021. The comparison group is defined based on
propensity score matching on three prepandemic characteristics: checking account overdraft amounts in February
2020, December 2019, and October 2019 (same as in figure 5). All specifications are identical to those in table 3.
These results—that people who live in areas with a high share of Universal Credit
beneficiaries accumulated more nonmortgage debt than their counterparts, but also carried less
credit card debt and lower checking account overdraft amounts, with no change in subprime loan
balances—suggest that consumers who were more likely to receive Universal Credit likely
carried other forms of nonmortgage debt, such as auto loans, during the first two years of the
pandemic.

19
Mortgage Forbearance
In this section, we present the effect of mortgage forbearance on nonmortgage debt. During
mortgage forbearance, from March 2020 through March 2021, mortgage holders were allowed to
defer full or partial mortgage payments by up to six months; therefore, one might expect
mortgage holders to have extra liquidity available during this period. We studied whether
mortgage holders used any extra cash to pay down their nonmortgage debt.
Although mortgage holders benefited from mortgage forbearance, no similar relief
policies were in place for adults without mortgages (i.e., probable renters). Given the policy
variation, we split the sample into two groups: mortgage holders (treatment group) and adults
without mortgages (control group). We assumed that, without expansive rental relief programs,
renters did not have additional liquidity to pay down their nonmortgage debt.
Mortgage holders and matched nonmortgage holders had similar prepandemic
nonmortgage debt levels in February 2020 (table 7, columns 2 and 3).
10
We found that the
average nonmortgage balance was £10,219 for mortgage holders and £9,989 for adults without
mortgages in February 2020. Mortgage holders tended to be older and lived in areas with fewer
people of color than adults without mortgages. The propensity scores matching process followed
the same procedure as described in the Universal Credit section, where we used three lagged
nonmortgage debt outcomes as baseline characteristics. Column (4) presents statistics for all
adults without mortgages. Comparing the number of unique consumers in Columns (3) and (4),
only a fraction of adults without mortgages were matched with mortgage holders because many
nonmortgage holders did not share similar debt characteristics to mortgage holders.
10
Similar to using the prepandemic share of Universal Credit beneficiaries, we used the prepandemic indicator of
mortgage holders. When the mortgage forbearance took into effect starting in March 2020, people might have been
inclined to apply for mortgages, which could cause endogeneity between our mortgage-holder indicator and our
outcome. Using February 2020 data to indicate mortgage holders helped us avoid endogeneity problems.

20
Table 7. The Socioeconomic Characteristics of Mortgage Holders and Adults without
Mortgages Are Very Similar.
Variables
Summary Statistics in February 2020
Mortgage
holders
Matched Adults
without
mortgages
Adults without mortgages
Panel A: Data from Lowell
Percent female
48.0%
48.8%
48.0%
Median age
50
40
39
Percent mortgage holders
100.0%
0
0
Average mortgage balance
£108,885
0
0
Average nonmortgage
balance
£10,219
£9,989
£5,314
Panel B: Data from the Office for National Statistics
Median percent of people of
color by ward
5.1%
8.0%
8.4%
Median share of Universal
Credit beneficiaries by ward
3.4%
3.6%
3.7%
Number of unique consumers
146,851
132,436
1,812,434
Source: We used individual-level administrative data from Lowell, one of Europe’s largest credit management
service companies, to track financially distressed consumers in the UK between October 2019 and December 2021.
Notes: Summary statistics for the two groups presented in figure 6: mortgage holders and adults without mortgages.
Column (1) lists the descriptions of each summary statistic. To match individuals in the treatment group with
individuals in the control group, we used propensity score matching based on three prepandemic characteristics:
nonmortgage debt in February 2020, December 2019, and October 2019. Column (4) presents summary statistics
unweighted by propensity scores for adults without mortgages. The number of unique consumers in Columns (3) is
less than in Column (4) because only a fraction of adults without mortgages were matched with mortgage holders
with similar nonmortgage balances during the propensity score matching process. After matching, the average
nonmortgage balances between the two matched groups (Columns 2 and 3) were close. Comparing Columns (2) and
(3), the share of female and the share of Universal Credit beneficiaries were similar between the two groups.
Mortgage holders tended to be older and lived in areas with lower shares of people of color.
Longitudinal trends of nonmortgage debt between adults without mortgages and
mortgage holders show that mortgage holders took on less nonmortgage debt than nonmortgage
holders during the mortgage forbearance period (figure 6). To further quantify the difference in
debt accumulation, we ran a series of regression models and present our results in table 8.
Overall, mortgage holders accumulated 1 percent less nonmortgage debt than adults without
mortgages (table 8). Results are statistically significant and robust across different regression
specifications.

21
Figure 6. Mortgage Holders Accumulated Less Nonmortgage Debt Than Adults Without
Mortgages during Mortgage Forbearance.
Source: We used individual-level administrative data from Lowell, one of Europe’s largest credit management
service companies, to track financially distressed consumers in the UK between October 2019 and December 2021.
Notes: Average nonmortgage balance between adults without mortgages (blue line) and mortgage holders (red line)
from October 2019 through December 2021. After the mortgage forbearance period (March 2020 through March
2021), mortgage holders accumulated less nonmortgage debt than nonmortgage holders (who are most likely
renters). We used mortgage balances in February 2020 to split our sample into two groups: if mortgage balance was
positive in February 2020, this given individual is defined as a mortgage holder. If the mortgage balance was zero,
this given individual is defined as an adult without mortgages. To match individuals in the treatment group with
individuals in the control group, we used propensity score matching using three prepandemic debt outcomes:
nonmortgage debt in February 2020, December 2019, and October 2019. Number of unique mortgage holders (red
line) = 132,436. Number of unique adults without mortgages (blue line) = 146,851. See table 7 for more summary
statistics.
4,800
4,900
5,000
5,100
5,200
5,300
5,400
5,500
Oct-19
Nov-19
Dec-19
Jan-20
Feb-20
Mar-20
Apr-20
May-20
Jun-20
Jul-20
Aug-20
Sep-20
Oct-20
Nov-20
Dec-20
Jan-21
Feb-21
Mar-21
Apr-21
May-21
Jun-21
Jul-21
Aug-21
Sep-21
Oct-21
Nov-21
Dec-21
Average Monthly Nonmortgage Balance
(£)
Adults without mortgages Mortgage holders
March-20: Mortgage
forbearance start
March-21: Mortgage
forbearance end

22
Table 8. Mortgage Holders Took on 1 Percent Less Nonmortgage Debt Than Adults
Without Mortgages during Mortgage Forbearance.
Outcome: Log of Nonmortgage Balances
(1)
(2)
(3)
(4)
During mortgage forbearance
0.0564***
0.0461***
0.0463***
0.0462***
(0.00297)
(0.00349)
(0.00350)
(0.00350)
Mortgage holders in February 2020
0.000126
-0.0455***
-0.0524***
-0.0554***
(0.00176)
(0.00211)
(0.00212)
(0.00212)
Mortgage forbearance X mortgage
holders in Feb 2020
-0.0156***
-0.0130***
-0.0130***
-0.0128***
(0.00207)
(0.00243)
(0.00243)
(0.00243)
Female
-0.0931***
-0.0915***
-0.0907***
(0.00109)
(0.00109)
(0.00110)
Age
0.00113***
0.000860***
0.000780***
(0.0000518)
(0.0000522)
(0.0000522)
Percent of people of color by ward
-0.00425***
-0.00579***
-0.00540***
(0.0000283)
(0.0000594)
(0.0000597)
UC share above median
-0.104***
(0.00167)
Month fixed effects
x
x
x
x
Parliamentary constituency fixed
effects
x
x
N
8,168,074
5,543,745
5,495,510
5,489,916
Mean dependent:
8.521
8.543
8.544
8.543
R2
0.000154
0.00544
0.0128
0.0135
Source: We used individual-level administrative data from Lowell, one of Europe’s largest credit management
service companies, to track financially distressed consumers in the UK between October 2019 and December 2021.
Notes: Regression results from difference-in-difference models to quantify the impact of mortgage forbearance
(March 2020–March 2021) on nonmortgage debt. The outcome variable is the log of nonmortgage balances from
October 2019 to December 2021. To match individuals in the treatment group with individuals in the control group,
we used propensity score matching on three prepandemic debt outcomes: nonmortgage debt in February 2020,
December 2019, and October 2019 (same as in figure 6). Specification (1) presents results from the baseline
regression model with three covariates: the time dummy variable indicating whether the individual was observed
during mortgage forbearance March 2020–March 2021, a dummy variable indicator of whether the individual was a
mortgage holder in February 2020, and the interaction of the two dummy variables. We used data in February 2020
to indicate whether a given individual was a mortgage holder. Because mortgage forbearance started in March 2020,
mortgage holders in February 2020 were most likely to be eligible for mortgage forbearance. In specification (2), we
added socioeconomic characteristics including gender, age, and race and ethnicity. We also added month-time fixed
effects to all the specifications. In specification (3), we added another geographic fixed effect, parliamentary
constituency specifically, to further control for underlying variations across location. In specification (4), we added
another control, which is an indicator of whether the given individual lived in an area with a share of Universal
Credit beneficiaries above the median. This was to control for the effect of the concurrent Universal Credit
expansion to have a cleaner identification for the impact of mortgage forbearance.
Similar to regression specifications for the Universal Credit expansion in table 3,
Specification (1) in table 8 presents results from the baseline regression model with three
covariates: the time dummy variable indicating whether the individual was observed during the
mortgage forbearance period, a dummy variable indicating whether the individual was a
mortgage holder in February 2020, and the interaction of the two dummy variables. We used

23
February 2020 data to indicate whether a given individual was a mortgage holder. Because
mortgage forbearance started in March 2020, mortgage holders in February 2020 were most
likely to be eligible for mortgage forbearance.
In specification (2), we added socioeconomic characteristics including gender, age, and
race and ethnicity. In specification (3), we added another geographic fixed effect—parliamentary
constituency—to further control for underlying variations across location. In specification (4) we
added a further control, which is an indicator of whether the given individual lives in an area
with a share of Universal Credit beneficiaries above the median. This was to control for the
concurrent Universal Credit expansion policy and more clearly delineate the impact of mortgage
forbearance. We also added month-time fixed effects to all specifications.
Comparing the trajectories of the specific debt types between mortgage holders and
adults without mortgages, we found that mortgage holders took on 1 percent more credit card
debt, 5 percent more in the amounts overdrafted from their checking accounts, and 2 percent less
in subprime loan balances than adults without mortgages during mortgage forbearance (figures
7–9 and tables 9–11).
11
These results suggest that, given the extra liquidity benefiting mortgage
holders during mortgage forbearance, they spent more by borrowing more on their credit cards
and even overdrawing on their checking accounts compared with adults with mortgages. At the
same time, they relied less on high-cost credit channels such as subprime loans. Overall,
mortgage holders accumulated less nonmortgage debt than nonmortgage holders.
11
For each debt type, we created debt-specific propensity scores using individuals’ prepandemic debt levels. For
example, we used three prepandemic credit card debts (February 2020, December 2019, and October 2019) as
covariates to predict individuals’ credit card debt since mortgage forbearance.

24
Figure 7. Mortgage Holders Carried More Credit Card Debt Than Adults without
Mortgages during Mortgage Forbearance.
Source: We used individual-level administrative data from Lowell, one of Europe’s largest credit management
service companies, to track financially distressed consumers in the UK between October 2019 and December 2021.
Notes: Average credit card balance between adults without mortgages (blue line) and mortgage holders (red line)
from October 2019 through December 2021. After the mortgage forbearance period (March 2020 through March
2021), mortgage holders accumulated more credit card debt than nonmortgage holders (who are most likely renters).
We used mortgage balances in February 2020 to split our sample into two groups: if mortgage balance was positive
in February 2020, the individual is defined as a mortgage holder. If the mortgage balance was zero, the individual is
defined as an adult without mortgages. To match individuals in the treatment group with individuals in the control
group, we used propensity score matching using three prepandemic debt outcomes: credit card debt in February
2020, December 2019, and October 2019. See table 9 for regression results that quantify the differences in credit
card debt between mortgage holders and adults without mortgages.
1,250
1,300
1,350
1,400
1,450
1,500
Oct-19
Nov-19
Dec-19
Jan-20
Feb-20
Mar-20
Apr-20
May-20
Jun-20
Jul-20
Aug-20
Sep-20
Oct-20
Nov-20
Dec-20
Jan-21
Feb-21
Mar-21
Apr-21
May-21
Jun-21
Jul-21
Aug-21
Sep-21
Oct-21
Nov-21
Dec-21
Average Monthly Credit Card Balance (£)
Adults without mortgages Mortgage holders
March-20: Mortgage
forbearance start
March-21: Mortgage
forbearance end

25
Figure 8. Mortgage Holders Accumulated Less in Subprime Loan Balances Than Adults
Without Mortgages during Mortgage Forbearance.
Source: We used individual-level administrative data from Lowell, one of Europe’s largest credit management
service companies, to track financially distressed consumers in the UK between October 2019 and December 2021.
Notes: Average subprime loan balances between adults without mortgages (blue line) and mortgage holders (red
line) from October 2019 through December 2021. After the mortgage forbearance period (March 2020 through
March 2021), mortgage holders accumulated less in subprime loan balances than nonmortgage holders (who are
most likely renters). We used mortgage balances in February 2020 to split our sample into two groups: if mortgage
balance was positive in February 2020, the given individual is defined as a mortgage holder. If the mortgage balance
was zero, the given individual is defined as an adult without mortgages. To match individuals in the treatment group
with individuals in the control group, we used propensity score matching using three prepandemic debt outcomes:
subprime loan balance in February 2020, December 2019, and October 2019. See table 10 for regression results that
quantify the differences in subprime loans between mortgage holders and adults without mortgages.
740
760
780
800
820
840
860
880
900
Oct-19
Nov-19
Dec-19
Jan-20
Feb-20
Mar-20
Apr-20
May-20
Jun-20
Jul-20
Aug-20
Sep-20
Oct-20
Nov-20
Dec-20
Jan-21
Feb-21
Mar-21
Apr-21
May-21
Jun-21
Jul-21
Aug-21
Sep-21
Oct-21
Nov-21
Dec-21
Average Monthly Subprime Loan
Balances (£)
Adults without mortgages Mortgage holders
March-20: Mortgage
forbearance start
March-21: Mortgage
forbearance end

26
Figure 9. Mortgage Holders Took on More in Checking Account Overdraft Amounts Than
Adults without Mortgages during Mortgage Forbearance.
Source: We used individual-level administrative data from Lowell, one of Europe’s largest credit management
service companies, to track financially distressed consumers in the UK between October 2019 and December 2021.
Notes: Average checking account overdraft amounts between adults without mortgages (blue line) and mortgage
holders (red line) from October 2019 through December 2021. After the mortgage forbearance period (March 2020
through March 2021), mortgage holders accumulated more in checking account overdraft amounts than
nonmortgage holders (who are most likely renters). We used mortgage balances in February 2020 to split our sample
into two groups: if mortgage balance was positive in February 2020, the given individual is defined as a mortgage
holder. If the mortgage balance was zero, the given individual is defined as an adult without mortgages. To match
individuals in the treatment group with individuals in the control group, we used propensity score matching using
three prepandemic debt outcomes: checking account overdraft amounts in February 2020, December 2019, and
October 2019. See table 11 for regression results that quantify the differences in checking account overdraft amounts
between mortgage holders and adults without mortgages.
540
560
580
600
620
640
660
680
700
720
Oct-19
Nov-19
Dec-19
Jan-20
Feb-20
Mar-20
Apr-20
May-20
Jun-20
Jul-20
Aug-20
Sep-20
Oct-20
Nov-20
Dec-20
Jan-21
Feb-21
Mar-21
Apr-21
May-21
Jun-21
Jul-21
Aug-21
Sep-21
Oct-21
Nov-21
Dec-21
Average Monthly Checking Account
Overdraft Amount (£)
Adults without mortgages Mortgage holders
March-20: Mortgage
forbearance start
March-21: Mortgage
forbearance end

27
Table 9. Mortgage Holders Carried 1 Percent More Credit Card Debt Than Adults without
Mortgages during Mortgage Forbearance.
Outcome: Log of Credit Card Balances
(1)
(2)
(3)
(4)
During mortgage forbearance
0.0442***
0.0120
0.0126*
0.0127*
(0.005)
(0.006)
(0.006)
(0.006)
Mortgage holders in February 2020
0.00207
-0.0719***
-0.0467***
-0.0484***
(0.003)
(0.004)
(0.004)
(0.004)
Mortgage forbearance X mortgage
holders in Feb 2020
0.00733*
0.0110**
0.0114**
0.0115**
(0.004)
(0.004)
(0.004)
(0.004)
Female
-0.157***
-0.149***
-0.147***
(0.002)
(0.002)
(0.002)
Age
0.0172***
0.0165***
0.0164***
(0.000)
(0.000)
(0.000)
Percent of people of color by ward
0.000491***
-0.00228***
-0.00172***
(0.000)
(0.000)
(0.000)
UC share above median
-0.118***
(0.003)
Month fixed effects
x
x
x
x
Parliamentary constituency fixed
effects
x
x
N
2,828,251
1,970,499
1,954,087
1,952,064
Mean dependent:
7.215
7.214
7.215
7.214
R2
0.000266
0.0223
0.0334
0.0343
Source: We used individual-level administrative data from Lowell, one of Europe’s largest credit management
service companies, to track financially distressed consumers in the UK between October 2019 and December 2021.
Notes: Regression results from difference-in-difference models to quantify the impact of mortgage forbearance
(March 2020–March 2021) on credit card debt. The outcome variable is the log of credit card balances from October
2019 to December 2021. To match individuals in the treatment group with individuals in the control group, we used
propensity score matching on three prepandemic credit card balances in February 2020, December 2019, and
October 2019 (same as in figure 7). All specifications are identical to those in table 8.

28
Table 10. Mortgage Holders Carried 2 Percent Less Subprime Loan Balances Than Adults
without Mortgages during Mortgage Forbearance.
Outcome: Log of Subprime Loan Balances
(1)
(2)
(3)
(4)
During mortgage forbearance
-0.000160
-0.0317***
-0.0320***
-0.0322***
(0.007)
(0.009)
(0.009)
(0.009)
Mortgage holders in February 2020
-0.0156***
-0.134***
-0.149***
-0.148***
(0.004)
(0.005)
(0.005)
(0.005)
Mortgage forbearance X mortgage
holders in Feb 2020
-0.0221***
-0.0229***
-0.0229***
-0.0228***
(0.005)
(0.006)
(0.006)
(0.006)
Female
0.0911***
0.0717***
0.0714***
(0.003)
(0.003)
(0.003)
Age
0.0163***
0.0155***
0.0155***
(0.000)
(0.000)
(0.000)
Percent of people of color by ward
0.000911***
0.00119***
0.00106***
(0.000)
(0.000)
(0.000)
UC share above median
0.0445***
(0.005)
Month fixed effects
x
x
x
x
Parliamentary constituency fixed
effects
x
x
N
960,299
675,227
668,180
667,288
Mean dependent:
6.678
6.666
6.668
6.668
R2
0.000378
0.0250
0.0624
0.0626
Source: We used individual-level administrative data from Lowell, one of Europe’s largest credit management
service companies, to track financially distressed consumers in the UK between October 2019 and December 2021.
Notes: Regression results from difference-in-difference models to quantify the impact of mortgage forbearance
(March 2020–March 2021) on subprime loans. The outcome variable is the log of subprime loan balances from
October 2019 to December 2021. To match individuals in the treatment group with individuals in the control group,
we used propensity score matching on three prepandemic subprime loan balances in February 2020, December
2019, and October 2019 (same as in figure 8). All specifications are identical to those in table 8.

29
Table 11. Mortgage Holders Carried 5 Percent More in Checking Account Overdraft
Amounts Than Adults without Mortgages during Mortgage Forbearance.
Outcome: Log of Checking Account Overdraft Amounts
(1)
(2)
(3)
(4)
During mortgage forbearance
-0.0416***
-0.0798***
-0.0950***
-0.0956***
(0.011)
(0.013)
(0.013)
(0.013)
Mortgage holders in February 2020
0.0103
-0.111***
-0.0867***
-0.0902***
(0.006)
(0.007)
(0.007)
(0.007)
Mortgage forbearance X mortgage
holders in Feb 2020
0.0459***
0.0359***
0.0462***
0.0468***
(0.007)
(0.009)
(0.008)
(0.008)
Female
-0.0754***
-0.0814***
-0.0813***
(0.004)
(0.004)
(0.004)
Age
0.0244***
0.0207***
0.0205***
(0.000)
(0.000)
(0.000)
Percent of people of color by ward
0.00191***
-0.00211***
-0.00134***
(0.000)
(0.000)
(0.000)
UC share above median
-0.183***
(0.006)
Month fixed effects
x
x
x
x
Parliamentary constituency fixed
effects
x
x
N
1,158,219
802,432
794,565
793,432
Mean dependent:
6.459
6.437
6.439
6.439
R2
0.000388
0.0217
0.0862
0.0874
Source: We used individual-level administrative data from Lowell, one of Europe’s largest credit management
service companies, to track financially distressed consumers in the UK between October 2019 and December 2021.
Notes: Regression results from difference-in-difference models to quantify the impact of mortgage forbearance
(March 2020–March 2021) on checking account overdraft amounts. The outcome variable is the log of checking
account overdraft amounts from October 2019 to December 2021. To match individuals in the treatment group with
individuals in the control group, we used propensity score matching on three prepandemic checking account
overdraft amounts in February 2020, December 2019, and October 2019 (same as in figure 9). All specifications are
identical to those in table 8.
Conclusion
We described the impacts of two economic policies the UK government implemented during the
first two years of the COVID-19 pandemic. During the expansion of Universal Credit, between
March 2020 and October 2021, we found that residents living in areas with a high share of
Universal Credit beneficiaries took on 1 percent more nonmortgage debt than those living in
areas with a low share of beneficiaries. Additionally, we described shifts in the mix of consumer
debt; specifically, residents living in areas with a high share of Universal Credit beneficiaries
took on 2 percent less credit card debt, no significant difference in subprime loan balances, and 1
percent less in checking account overdraft amounts than those living in areas with a low share of

30
beneficiaries. Universal Credit recipients may have carried other forms of nonmortgage debt,
such as loans,
12
during the first two years of the pandemic. During mortgage forbearance,
between March 2020 and March 2021, mortgage holders accumulated 1 percent less
nonmortgage debt than adults without mortgages. Additionally, mortgage holders carried 1
percent more credit card debt, 2 percent less in subprime loan balances, and 5 percent more in
checking account overdraft amounts than nonmortgage holders during mortgage forbearance.
Our results suggest that when debt relief is of the magnitude of mortgage forbearance, consumers
pay down high-cost subprime loans and spend more on credit cards. Future research is needed to
study the factors that cause these shifts within nonmortgage debt types.
Although the UK government intended to increase Universal Credit benefits to help
workers who had low incomes or were unemployed smooth consumption and borrow less during
the pandemic, our results suggest that the £20 per week increase made little difference for
vulnerable workers and their families—despite the government intervention, consumer debt
levels continued to increase. By contrast, mortgage holders did appear to benefit from mortgage
forbearance, although no similar relief policies were implemented for those without mortgages.
The latter group were likely renters and, because renters on average earn less than homeowners,
the combined impact of these two UK government policies suggests that individuals with lower
incomes are carrying increasingly more debt than individuals with middle or higher incomes two
years after the pandemic. These results suggest that policies implemented in the UK to protect
financially vulnerable families might have exacerbated prepandemic inequalities. Future policies
could build on the benefits afforded to homeowners by providing similar benefits to renters.
12
See figure 4 in ONS (2019) for different components of nonmortgage debt in the Great Britain (UK excluding
Northern Ireland), where loans and student loans are the two largest sources of household debt:
https://www.ons.gov.uk/peoplepopulationandcommunity/personalandhouseholdfinances/incomeandwealth/bulletins/
householddebtingreatbritain/april2016tomarch2018.
31
References
Almeida, Vanda, Salvador Barrios, Michael Christl, Silvia De Poli, Alberto Tumino, and Wouter van der Wielen.
2021. “The Impact of COVID-19 on Households Income in the EU.” Journal of Economic Inequality 19 (3):
413–31.
Beirne, John, Peter J. Morgan, and Tetsushi Sonobe. 2021. COVID-19 Impacts and Policy Options: An Asian
Perspective. Tokyo, Japan: Asian Development Bank Institute.
Braga, Breno, Signe-Mary McKernan, William J. Congdon, Elizabeth Mandiville, Mark Hayward, and Christopher
Trepel. 2021. “Financial Vulnerability in the United Kingdom: From Brexit to the COVID-19 Pandemic.”
Washington, DC: Urban Institute.
Braga, Breno, Signe-Mary McKernan, William J. Congdon, Kassandra Martinchek, Alexander Carther, Caleb
Quakenbush, Elizabeth Mandiville, Mark Hayward, and Christopher Trepel. 2022. “Tracking Financial
Vulnerability in the UK.” Washington, DC: Urban Institute; London, UK: Lowell.
Braga, Breno, Signe-Mary McKernan, and Hannah Hassani. 2019. “Delinquent Debt Decisions and Their
Consequences over Time.” Washington, DC: Urban Institute.
Braga, Breno, Signe-Mary Mckernan, Caroline Ratcliffe, Brett Theodos, John Chalekian, and Christopher Trepel.
2019. “Local Conditions and Debt in Collections.” Journal of Consumer Affairs 53 (4): 2,058–85.
Blundell, Richard, Monica Costa Dias, Jonathan Cribb, Robert Joyce, Tom Waters, Thomas Wernham, and Xiaowei
Xu. 2022. “Inequality and the COVID-19 Crisis in the United Kingdom.” Annual Review of Economics 14:607–
36.
Cherry, Susan F., Erica Xuewei Jiang, Gregor Matvos, Tomasz Piskorski, and Amit Seru. 2021. “Government and
Private Household Debt Relief during COVID-19.” Working Paper No. 28357. Cambridge, MA: National
Bureau of Economic Research.
Chetty, Raj, John N. Friedman, Nathaniel Hendren, and Michael Stepner. 2022. “The Economic Impacts of COVID-
19: Evidence from a New Public Database Built Using Private Sector Data.” Working Paper No. w27431.
Cambridge, MA: National Bureau of Economic Research.
Core, Fabrizio, and Filippo De Marco. 2021. “Public Guarantees for Small Businesses in Italy during COVID-19.”
CEPR Discussion Paper No. DP15799. Available at SSRN: https://ssrn.com/abstract=3784039.
Cromarty, Hannah, Wendy Wilson, and Cassie Barton. 2021. “Mortgage Arrears and Repossessions (England).”
London: House of Commons Library.
Federal Reserve Board. 2020. Update on the Economic Well-Being of US Households: July 2020 Results.
Washington, DC: Board of Governors of the Federal Reserve System.
Financial Conduct Authority (FCA). 2020. “Mortgages and Coronavirus: Payment Deferral Guidance.” London:
FCA.
Han, Jeehoon, Bruce D. Meyer, and James X. Sullivan. 2020. “Income and Poverty in the COVID-19 Pandemic.”
Working Paper No. w27729. Cambridge, MA: National Bureau of Economic Research.
Hobson, Frank. 2021. Coronavirus: Withdrawing Crisis Social Security Measures. London: House of Commons
Library.
IMF (International Monetary Fund). 2021. “Policy Responses to COVID-19.” Accessed on November 3, 2022.
Legatum Institute. 2020. Poverty during the COVID-19 Crisis. London: Legatum Institute.
Marinescu, Ioana, Daphne Skandalis, and Daniel Zhao. 2021. “The Impact of the Federal Pandemic Unemployment
Compensation on Job Search and Vacancy Creation.” Journal of Public Economics 200:104471.
32
Miguel, Edward, and Ahmed Mushfiq Mobarak. 2022. “The Economics of the COVID-19 Pandemic in Poor
Countries.” Annual Review of Economics 14: 253–85.
New York Fed (Federal Reserve Bank of New York). 2021. Quarterly Report on Household Debt and Credit: 2020:
Q4. New York: Federal Reserve Bank of New York Research and Statistics Group.
O’Connell, Martin, Áureo De Paula, and Kate Smith. 2021. “Preparing for a Pandemic: Spending Dynamics and
Panic Buying during the COVID‐19 First Wave.” Fiscal Studies 42 (2): 249–64.
ONS (Office for National Statistics). 2019. “Household Debt in Great Britain: April 2016 to March 2018.” Accessed
on January 19, 2023.
———. 2020. “Employment in the UK: December 2020.” Accessed on December 21, 2022.
———. 2021. “Census 2021: England.” Accessed on November 3, 2022.
Pilkauskas, Natasha, Katherine Michelmore, Nicole Kovski, and H. Luke Shaefer. 2022. “The Effects of Income on
the Economic Wellbeing of Families with Low Incomes: Evidence from the 2021 Expanded Child Tax Credit.”
Working Paper No. w30533. Cambridge, MA: National Bureau of Economic Research.
Romer, Christina D. 2021. “The Fiscal Policy Response to the Pandemic.” Brookings Papers on Economic Activity
(spring 2021): 89–110.
Schanzenbach, Diane Whitmore, Ryan Nunn, Lauren Bauer, David Boddy, and Greg Nantz. 2016. Nine Facts about
the Great Recession and Tools for Fighting the Next Downturn. Washington, DC: The Hamilton Project,
Brookings Institution.
